Advisor Perspectives welcomes guest contributions. The views presented here do not necessarily represent those of Advisor Perspectives
Data mining is a huge risk with factor-based investment strategies. Many factors have proven to not work in practice and even the most popular factors, like value and momentum, may prove less effective going forward. Crowding in factor strategies, changes in the economy and new business models may eliminate any potential excess return from simple screening metrics that form the basis for many factors. Investors can avoid being fooled by backtests by keeping in mind that most attempts to beat markets will fail because trading is a zero-sum activity.
There are cause and effect relationships in the world and in investing that hold true over time. Many are common sense and easily observable – like fire creates smoke – while others are harder to see and understand. With investing, true relationships can be hard to see because of randomness and noise in data, and there’s a risk we convince ourselves certain relationships exist that really do not (e.g. smoke creates fire). In much of quantitative finance, data is mined to show a certain effect, but the logic behind the cause and effect relationship is not robust. Then suddenly, because of evidence in noisy historical data, investors begin to believe that smoke creates fire.
When historical evidence disagrees with our logic, investors should favor applying a fundamental understanding over what a backtest prescribes.
Factor investing is an area I have researched and written about extensively (see here, here and here) . It is an approach to active management that is lower cost and backed by decades of historical data, compared to the standard high-cost, overdiversified stock picking approach that has failed. But it is still active management, and with active management there is a loser for every winner. That’s a fact of markets. Normally the few winners in active management leverage a few key insights that are not recognized by the masses, at least at the time. In contrast, most active management losers tend to copy each other, using the same strategies and managers.
Factor investing is, by its nature, transparent and therefore easily copied. This is why many factor investing strategies are increasingly problematic. Data mining, factor crowding, as well as economic changes are all reasons why such strategies may disappoint. Popular value and momentum strategies are used as examples throughout this thought piece to illustrate. Keep in mind, I am not trying to definitively say that such factor strategies do not work, but instead hoping potential users of these strategies will pause and ask deeper questions about them. In the end, we can never forget the unavoidable fact that trading and beating markets is a zero-sum game.
Data mining is a risk even with value and momentum strategies
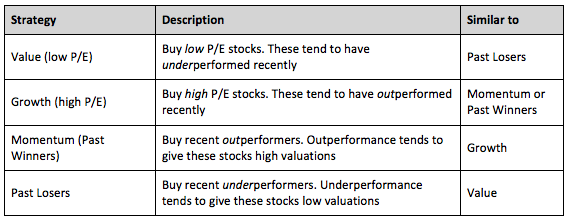
Value is the buying of “cheap” assets, at least based on measures such as a low price-to-earnings (P/E) ratio for stocks. This is the opposite of growth or high P/E stocks, which are statistically expensive. Typically, the way a stock becomes relatively cheap is by underperforming in the recent past, and vice versa for growth stocks. Momentum strategies can be compared similarly. Buying past winners (momentum stocks) is about buying stocks that have recently outperformed on the basis that their trend will continue. The opposite is past losers (or low momentum). The table below summarizes these four strategies and how they logically relate to each other.

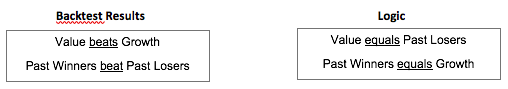
But the logic explained above is at odds with the academic research backed by decades of market data across time and geography. The below summarizes the difference between what the backtests say versus logic. Both cannot simultaneously be true. Smoke cannot both be created by fire (logical) and produce it (evidence from backtests).
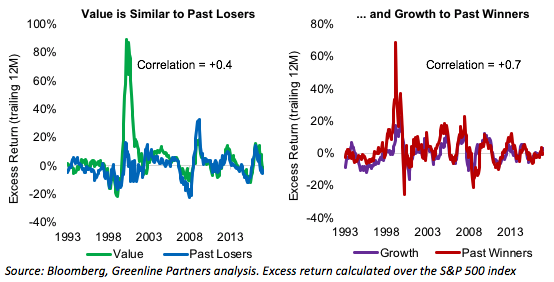
If this logic is correct, then we should see that value is highly correlated to past losers and same for momentum to growth. To test, I simulated portfolios over the last 25 years where value is defined as the one-third of the market with lowest P/E, growth is one-third of the market with the highest P/E, past winners (high momentum) is the one-third of the market with best trailing 200-day returns, and past losers is the one-third of the market with the worst trailing 200-day returns. I used the Bloomberg equity database to simulate but these results are similar to what one would find in the commonly used Ken French Data Library. Some might ask why test over only 25 years when there is more data available. Markets and economies change and adapt to new information. While I have tested these strategies going back to the 1920s, more recent data is more relevant to today’s market conditions, which I also discuss later in this paper.
The charts below compare the returns over rolling 12-month periods for value versus past losers, and momentum versus growth. To isolate the impact of value, growth, momentum, and past losers, I subtracted returns of the S&P 500 from them to isolate their excess return.
Two things stand out. First is that my logic is correct. There is a high correlation between value and past losers most of the time, as well as with growth to momentum. This partly explains why value and momentum are negatively correlated: they select for opposite segments of the market (i.e. value and growth should be negatively correlated). Second is that most of the return difference between the strategies was during a single, isolated market event, the Dot.com bubble and bust of 1998-2002. This was an anomalous period in markets when any strategy that was underweight technology stocks outperformed. Outside of this period, these strategies mostly delivered tracking error relative to a broad index like the S&P 500.
Selecting a stock based on a high P/E ratio is clearly different than selecting one based on its recent past performance. That is the point here. Despite these differences, the nature of their excess returns is similar and therefore concerning. For example, past winners selects solely based on past price moves and is a high turnover strategy (4-8x/year). Value, on the other hand, selects based on accounting measures, like earnings, and is relatively low turnover (<1x/year).
As an aside, this suggests it may be better to define the value premium as long low P/E stocks (value) and short past losers, instead of the traditional definition of long value and short growth. This alternative construction would extract any premium from selecting cheap assets based on valuation instead of past price performance. Similarly, the momentum premium may be better defined as long past winners and short growth stocks. A topic for further study.
This pattern of factor strategies outperforming during extreme market periods also supports my prior research that they are best used as screens to help avoid losers.
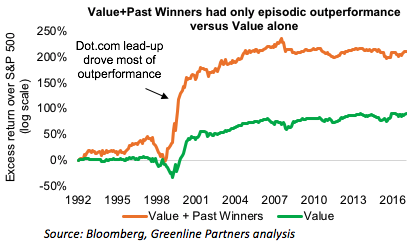
Combining value and momentum has episodic outperformance versus value alone
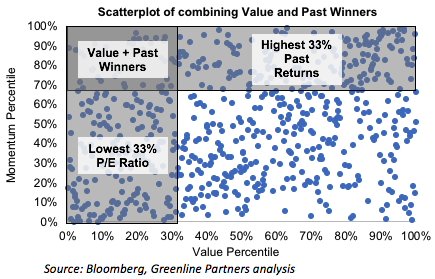
If momentum (past winners) is similar to growth, then combining value and komentum should not be a good idea, as they will cancel each other out. Put another way, combining value and growth is like buying the whole market.
To illustrate, I simulated a portfolio that is a sequential combination of value and momentum (I know there are multiple techniques for combining both factors, but other methods give a similar conclusion). The chart below sorts the universe of 500 equities in the S&P 500 along their value and momentum scores to show how the combined portfolio is derived.
The chart below compares the excess returns over the market of the value plus past winners to value alone. While the cumulative returns of the combined factor portfolio look amazing, we can see that its returns were largely isolated to the Dot.com period.
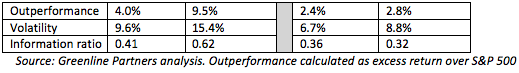
I therefore show the summary statistics below since 1993 and since 2003, to show that since the end of the Dot.com period, the risk-adjusted performance of value plus past winners has actually been worse than using value alone.
Again, my point here is only to provide food for thought on the topic of whether certain risk-factor premia exist and what expectations one should use for their returns going forward. Based on their returns having largely been determined by a few historical events, a zero expected return for these factor premia would be a reasonable starting point. In the end, alpha is a zero-sum game, and never in history has a simple strategy, copied by the masses, generated meaningful outperformance.
By definition, it cannot.
Past performance is not a guarantee of future results, especially when backtested
There are additional changes in the economy and markets that further weakens the basis for risk factor strategies, which I discuss next.
I purposely picked only the past 25 years for my simulations in the first section of this paper. This was around the time academics like Eugene Fama, Ken French, Joseph Lakonishok and others published the seminal papers on the value and momentum effects. Since that time, many billions of dollars have been put to work in these strategies. Markets by their nature tend to price in new information and we cannot ignore this fact.
Crowding will reduce returns
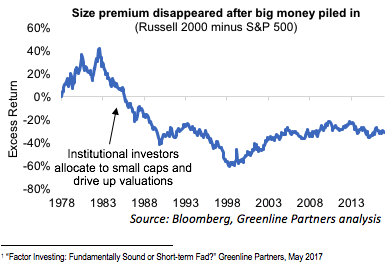
Crowding with risk factor strategies is a topic I and others have commented on in the past[1]. One example of this is the elimination of the size premium. Logic says that smaller companies should, on average, outperform larger ones to compensate for their higher risk. But since institutional investors began making strategic allocations to this asset class in the early 1980s, this size premium disappeared, as shown in the chart below of the excess return of small- stocks minus large-cap stocks.
This crowding effect will negatively impact all factors returns as now hundreds of billions of dollars or more are now deployed in these strategies. And we will only be able to definitively measure this impact many years down the road.
Changes in the economy will reduce the effectiveness of certain factor definitions
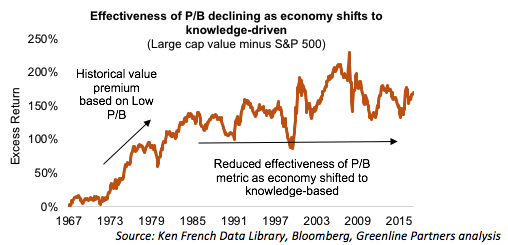
Just as markets adapt and evolve, so do business and the economy. As one example, the U.S. economy has transitioned from being dependent on manufacturing and physical capital to one dependent on intangible knowledge capital in services and technology businesses. This means an increasing amount of the average company’s value is no longer reflected on their financial statements. Intangibles, like intellectual property and proprietary data, are of great value but generally not recorded on a balance sheet, reducing the effectiveness of a measure such as book equity value.
This change in our economy explains why the price-to-book equity (P/B) measure has been ineffective for selecting value companies for over 30 years. The chart below shows the cumulative returns of value, as measured by low P/B, since 1965. We can see its performance relative to the market has become largely ineffective since the early 1980s, something others have confirmed as well[2].
Valuation is the anchor for markets, but it is complex. Using simple metrics like price-to-earnings ratios is only a shortcut, but one that has statistically worked, at least historically. In practice, any factor that measures the growth rate and quality of underlying cash flows should be factored into valuation. And as accounting rules change and as business models evolve, this will all determine the effectiveness of metrics that worked in the past.
To avoid mistakes, have the right framework
In this era of big data and cheap computing power, it is easy for anyone to create a winning investment strategy in a backtest. But investing is forward-looking and markets are adept at pricing in known information. Often, a strategy has a one-off experience that drives its outperformance, which is masked in summary statistics. We see this in risk-factor strategies, even value and momentum. If these one-off events do not repeat, most factor strategies are at risk of being ineffective going forward.
Investing is complex, and there is always more randomness and noise than signal in the data we observe. Managers who outperform, even over long periods like 10 years, often do not repeat their feat. Applying a few logical principles to this complex problem can help cut through the noise. Two such principles are that markets are hard to beat (since trading is a zero-sum), even before fees and trading costs; and always favor a logical explanation over statistics.
“Organized common (or uncommon) sense is an enormously powerful tool. There are huge dangers with computers. People calculate too much and think too little.”
— Charlie Munger
Maneesh Shanbhag is co-founder of Greenline Partners and is responsible for the investment process. Greenline Partners is an asset management and advisory firm focused on constructing unlevered, cost and tax-efficient portfolios across multiple asset classes. We work with a range of investors including foundations, endowments, family offices and wealth advisors as both an investment manager and advisor. The firm was founded by alumni of Bridgewater Associates, who served on the firm’s investment team and acted as lead advisors on asset allocation, liability management, risk budgeting and manager selection for leading institutional investors including pension funds, endowments, foundations and family offices.
Greenline Partners is headquartered in New York, NY with offices in Seattle, WA. For more information, please visit http://www.glinepartners.com or email [email protected].
[1] “Factor Investing: Fundamentally Sound or Short-term Fad?” Greenline Partners, May 2017
[2] Fama, Eugene F. and Kenneth R. French, 2012. “Size, Value, and Momentum in International Stock Returns”. Journal of Financial Economics 105, 457-472.
Read more articles by Maneesh Shanbhag