Americans have under-saved and will need more than withdrawals from savings to survive retirement. An optimal withdrawal strategy and asset allocation, delaying Social Security, annuitizing, tapping home equity and possibly working longer need to be evaluated. Let’s take a typical American couple and evaluate which options improve retirement consumption.
The example
I used data from the BLS Consumer Expenditure Survey and the Fed’s Survey of Consumer Finances Chartbook to develop an example of a typical American retirement-age couple. This particular example is for a retiring married couple, both 65, who were earning a combined $75,000 prior to retirement and hope to spend $60,000 per year in retirement (an 80% replacement rate). They have $200,000 in savings and an un-mortgaged home also worth $200,000. Their combined Social Security at age 65, estimated using the Quick Calculator, is $27,984. They don’t have other sources of income, so they are starting out well short of their desired $60,000. (All dollar figures in this article are in real 2018 dollars unless otherwise noted. More details about the example, investment and product assumptions, and definitions of retirement outcome measures are in the Appendix.)
Initial results
Typical planning guidelines are that savings at retirement should be eight- to 12-times preretirement earnings, but here savings are a paltry 2.67-times. I’ll first test an approach where the couple goes into retirement without a real strategy, and then test strategies to improve on this base.
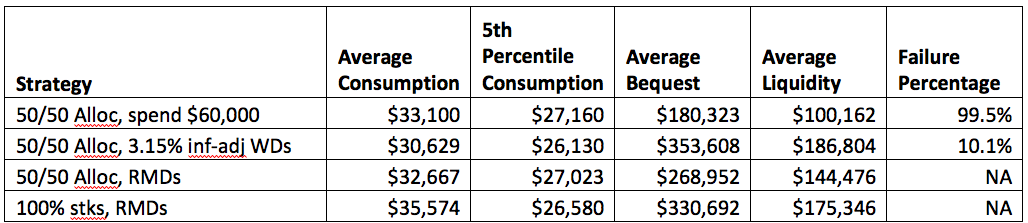
I first assume they launch into retirement by withdrawing the full difference between their Social Security and the $60,000 of desired spending, with their savings allocated 50/50 stocks/bonds. The results are shown on the first line of the chart below, and – no surprise – there are problems.

The key performance measure for this strategy is the failure percentage indicating that there is only a 0.5% chance of getting through retirement without fully depleting savings. The likely outcome is a lot of years living on Social Security only. The bequest shown is mostly the home value (which I reduce by 10% to account for costs of disposing of the property).
Next I ask how much withdrawals would need to be reduced to bring the failure percentage down to a more reasonable 10%. The answer turns out to be withdrawals of about $6,300 per year, equivalent to a 3.15% inflation-adjusted withdrawal rate. This is more conservative than the familiar 4% rule and is a reflection of my assuming lower future returns for stocks and bonds. The key result, shown on the second line of the chart, is that average consumption is only about half of the desired $60,000. The $30,629 of average consumption is less than the $27,984 of Social Security plus $6,300 of withdrawals, which reflects both the 10% of failure cases where to consumption drops to Social Security only, and reduced Social Security in years where only one member of the couple is alive.
A problem with using inflation-adjusted withdrawals is that they do not adjust to recognize investment performance. To produce a safe withdrawal rate it’s necessary to reduce consumption a lot and leave a substantial average bequest. This is wasteful if the primary goal is to increase retirement spending. The third line of the chart shows the result of switching to withdrawals based on the factors for required minimum distributions (RMDs). These factors are applied to the current level of retirement savings so they automatically adjust the dollar amount of withdrawals for investment performance – better performance produces more assets and greater withdrawals. The RMD factors increase with age – 3.65% at age 70, 5.35% at age 80, and 5.77% at age 90 – aimed at conservatively spreading consumption over remaining life expectancy.
By switching to RMDs, we see that average consumption increases by $2,000 and we lower the average bequest by nearly $100,000, so we are pulling money out of savings and putting it in consumption. We do so without increasing risk. The failure percentage is no longer a meaningful risk measure because RMDs never completely deplete savings, so we now measure risk based on 5th percentile consumption. We see that this measure actually improves with RMDs, even though there is higher average consumption and a smaller bequest.
In the bottom line on the chart, we test another strategic move of raising the stock allocation to 100%. This might seem radical, but we need to consider Social Security, which is akin to a fixed income asset. For this particular case about 80% of consumption comes from Social Security and 20% from withdrawals from saving, so the allocation of the assets for consumption is equivalent to a conservative 20/80 stock/bond split. This is quite different than for typical advisory clients with more substantial wealth. The result of raising the stock allocation is that we increase average consumption by close to $3,000 while only slightly worsening the 5th percentile risk measure – a favorable tradeoff.
Testing more strategies
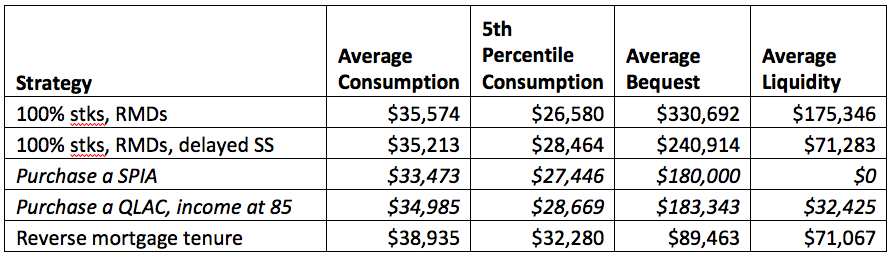
The chart below shows results for testing more strategies – delayed Social Security, two types of annuities and a reverse mortgage. The top line for reference is the bottom line from the previous chart.
The particular delayed Social Security strategy I’m testing involves the wife claiming at age 66 and the husband delaying until 70. This increases Social Security income from $27,984 to $35,126. With retirement at 65 for both the husband and wife, this will require using a portion of savings to provide bridge income until Social Security fully kicks in at 70. The couple will need to set aside $118,000 of savings for the bridge, leaving only about $82,000 for RMD withdrawals.
The result in the second line is actually a slight decrease in average consumption, but a substantial improvement in the 5th percentile risk measure, a favorable tradeoff for delaying Social Security. The slight decrease in average consumption reflects the fact that we are taking funds out of a 100% stock portfolio to provide bridge income. But we are also replacing stock volatility with steady Social Security income, which considerably improves the risk measure.
The next two lines show results for testing two different annuity options, and they are shown in italics because they don’t improve outcomes, and therefore are not worth using. First we test taking the remaining $82,000 of savings and use it to purchase a single-premium immediate annuity (SPIA) that pays an annual inflation-adjusted $3,156. This would be a questionable strategy regardless of outcomes because it would take away all liquidity. But it also fails on both the average and 5th percentile consumption measures, so we can write it off. With Social Security so dominant, we already have what is effectively a heavily annuitized portfolio. We are better off leaving a small amount in stocks rather than annuitizing with a SPIA.
In the next line I try a strategy using a qualified longevity annuity contract (QLAC), which is a form of a deferred-income annuity (DIA). Here a $20,000 contract is purchased at age 65 and payments equal to the SPIA payments above begin at 85. Because I know the QLAC income will begin at 85, I’ve made the withdrawals from the remaining $62,000 of savings more aggressive than RMDs in order to use up savings in 20 years and increase consumption. Although this strategy works better than the SPIA, it doesn’t improve on the no-annuity strategy on the second line of the chart, so I reject it as well.
In the final line of the chart I show the results of using a reverse mortgage tenure arrangement, which makes level nominal monthly payments for as long as the home is occupied. Retirement consumption improves because a reverse mortgage provides access to a new source of funds. It moves what would have been a full home inheritance at least partially into consumption. In this example, the reverse mortgage loan payoff, when the homeowners leave, lowers the average bequest below the home value. Another way to use a reverse mortgage would be to set up a line of credit (LOC) and take withdrawals similar to generating consumption from savings. For this particular example, tenure produced slightly better results than an LOC. There is some risk with reverse mortgages in that the homeowner is required to maintain the property and use it as their primary residence. For this particular case the average liquidity of $71,000 indicates that there is some cushion to cover such expenses.
Working longer
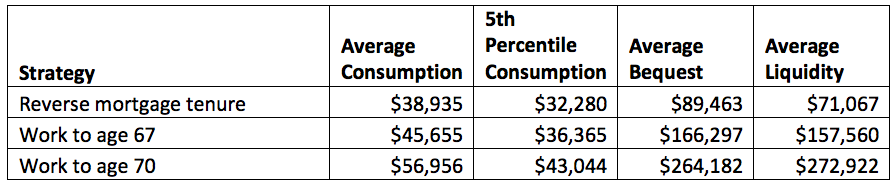
We’ve covered all the options for retiring at age 65 and have been able to increase average consumption from $30,000 to $39,000, but we’re still well short of the $60,000 target. What’s left is examining the impact of working longer, which is a particularly powerful way to increase retirement consumption. There are four separate effects from working longer that combine positively: growth of existing savings, additional savings from future work, less need for bridge funds to delay Social Security and a shorter retirement that needs to be funded.
The following chart begins with the best outcome from the previous chart and tests working to ages 67 and to 70. I assume earnings remain at a real $75,000, 15% is saved and all savings earn a 5% real return. Social Security also increases because the wife now claims at retirement age instead of 66. We can see that working longer significantly improves every performance measure.
Summary
The chart below provides a summary showing each of the improvements in average consumption as a percentage of a base case of a 50/50 allocation and a 3.15% inflation-adjusted withdrawal rate from the first chart. Average consumption increases from $30,629 to $56,956, an 86% increase.
|
Strategy
|
Consumption
Increase Percent
|
|
50/50 Alloc, 3.15% inf-adj WDs
|
0.0%
|
|
Switch to RMDs
|
6.7%
|
|
Allocate 100% to stocks
|
9.5%
|
|
Delay SS
|
-1.2%
|
|
Add reverse mortgage tenure
|
12.2%
|
|
Work to 67
|
21.9%
|
|
Work 3 more years to 70
|
36.9%
|
|
Total
|
86.0%
|
The increase from switching to a 100% stock allocation is modest because there isn’t a lot of savings at age 65. Delaying Social Security doesn’t increase consumption for this example, but it significantly reduces downside risk. The use of a reverse mortgage provides a significant benefit by accessing a new source of funds. The biggest improvements in retirement prospects come from working longer. For those who don’t save enough, it is a big plus to have stable employment in a good job, and to keep building job skills while maintaining good health. More human capital makes up for less financial capital.
Joe Tomlinson, an actuary and financial planner, is managing director of Tomlinson Financial Planning, LLC in Greenville, Maine. Most of his current work involves research and writing on financial planning and investment topics. This article has benefited from discussions and joint research projects with researchers Dirk Cotton, Wade Pfau, and Steve Vernon, and NewRetirement’s Steve Chen. The conclusions are the author’s.
Appendix
Retirees
- Married couple, both 65 at retirement (also test working longer)
- Life expectancies: Husband 86, Wife 88, with stochastic mortality
- Pre-retirement income: $42,000 for husband, $33,000 for wife, $75,000 combined
- Desired retirement spending: $60,000 (80% replacement of $75,000)
- Savings at 65: $200,000
- Home value: $200,000, un-mortgaged, heirs recover 90% of home value at death
- Additional annual savings for delayed retirement: 15% of $75,000 = $11,250
- Social Security (couple): $27,984 @ 65, $35,126 with H(70), W(66)
Investment and Product Assumptions
- Inflation: 2.15% (but all values shown in real 2018 dollars)
- Arithmetic average real returns: Stocks 5%, Bonds 0.7% (net of fees, if any)
- Standard deviations: Stocks 20%, Bonds 7%
- Income taxes: zero
- SPIA at 65: pays an annual $3,155.77 per $81,651 purchase for couple reduced by 1/3 at first death, payments increase annually based on actual inflation
- QLAC purchased at 65: pays annual nominal $5,699.57 per $100,000 purchase for couple reduced by 1/3 at first death, payments beginning at 85 and increase annually at 3% (intended to roughly match the real SPIA payments starting at 85)
- Reverse mortgage (based on NRMLA calculator)
- Principal limit: $88,800
- Fees: $10,276
- Net Principal Limit: $78,524
- Tenure option: $4,897.56 nominal, annualized
Performance measures
-
Average Consumption: The average annual consumption generated from SS, withdrawals from savings, SPIAs and QLACs if any, and from any reverse mortgage options.
-
5th Percentile Consumption: The 5th percentile from 10,000 Monte Carlo simulations, indicating a 95% probability of consumption above this level
-
Average Bequest: The average of remaining savings plus remaining home value (assuming 90% recovery on sale) reduced by any reverse mortgage loan balance up to the amount of home value.
-
Average Liquidity: The average of beginning and ending liquidity.
-
Failure Percentage: Out of 10,000 Monte Carlo simulations, the percentage that deplete savings before death.
Processing
The computer model runs 10,000 Monte Carlo simulations. Stock and bond returns are randomly generated for each year based on assumptions for mean arithmetic returns and standard deviations. The lifetimes of each member of the married couple are also randomly generated in each of the 10,000 simulations based on a Gompertz mortality function scaled based on input life expectancies.
Read more articles by Joe Tomlinson