Advisor Perspectives welcomes guest contributions. The views presented here do not necessarily represent those of Advisor Perspectives.
The founder of Vanguard, Jack Bogle, says that over the next decade a conservative portfolio of bonds will only return about 3% a year and stocks about 4% a year. However, returns can be improved with a dynamic asset-allocation strategy that adjusts stock- and bond-fund holdings in a retirement account according to the market climate.
I compare the performance of the Vanguard LifeStrategy Moderate Growth Fund (VSMGX), which holds static investments of 60% equity and 40% bond funds, with a model holding identical assets, but which switches to 100% bond funds during equity down-market periods. I call this the Dynamic MAC 60:40 Model.
For a $1 million initial VSMGX investment in January 1999, one could have withdrawn on average a real (inflation-adjusted) $2,420 per month and still keep the original investment intact to November 2017. The monthly withdrawal amount can be more than doubled by adjusting the investment according to market climate, as indicated by a 50-200 day moving-average-crossover system of the S&P 500. This would have allowed an average withdrawal of a real $5,480 per month for almost 19 years, while still retaining a real $1,000,000 in the retirement account at the end.
I backtested my model using the on-line simulation platform Portfolio 123, which also provides extended price data for ETFs prior to their inception dates, and economic and financial data. The model assumptions are:
- Slippage1 and trading costs were ignored, and closing prices were assumed for the simulation.
- Trades occur on the first business day of a week based on signals from the market climate indicator.
- A 40-day minimum holding period for a position was specified so that mutual funds can also be used instead of ETFs.
- Rebalancing to nominal allocation weighting was assumed to occur every 52 weeks, at the end of a calendar year. Rebalancing transactions, which amount to less than 5% of portfolio value, are excluded.
The start date of the backtest was 1/2/1999, because this is the earliest start date for a simulation on Portfolio 123.
Model philosophy
The model holds ETFs corresponding to the mutual funds in the Vanguard LifeStrategy Moderate Growth Fund (VSMGX) and in the same allocation of 60% stocks and 40% bonds during equity up-markets. Unlike VSMGX, which has a static allocation, the Dynamic MAC 60:40 Model uses a dynamic allocation strategy and switches to 100% bonds during equity down-markets. The nominal asset allocations are below.
During equity up-markets: (same as for VSMGX):
- 36% Vanguard Total Stock Market ETF (VTI)
- 24% Vanguard FTSE Developed Markets ETF (VEA)
- 28% Vanguard Total Bond Market ETF (BND)
- 12% Vanguard Total International Bond ETF (BNDX)
During equity down-markets:
- 17.5% Vanguard Total Bond Market ETF (BND)
- 7.5% Vanguard Total International Bond ETF (BNDX)
- 75% Vanguard Mortgage-Backed Securities ETF (VMBS)
Equity down-markets are signaled by a simple 50-200 day moving-average-crossover system of the S&P 500. When the 50-day moving average moves from above to below the 200-day moving average the stock ETFs VTI and VEA are sold and replaced with the bond ETFs and held until the 50-day moving average moves from below to above the 200-day moving average, but at least for 40 days.
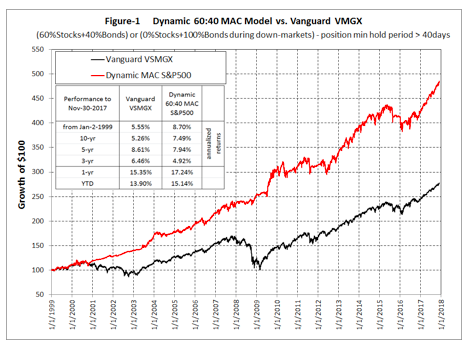
Performance of the Dynamic MAC 60:40 Model
In Figure-1 below the red graph represents the model. It depicts the performance when using a 50-200 day moving-average-crossover system of the S&P 500 as an indicator, and the black graph shows the performance of VSMGX.
It is obvious that a dynamic asset strategy is preferable to a buy-and-hold investment of VSMGX.

Risk
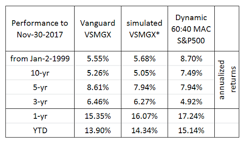
For the risk measurement calculations I used a simulated model (which I denote as VSMGX)* that holds the current asset allocation of the Vanguard LifeStrategy Moderate Growth Fund (VSMGX) unchanged from January 2, 1999. Its performance closely matches that of the real VSMGX.
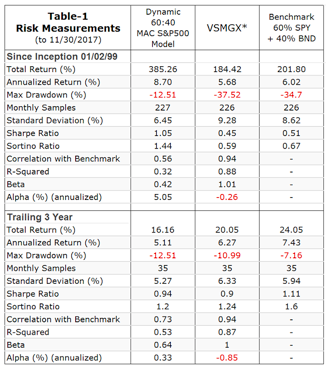
Table-1 below shows that VSMGX* has the worst maximum drawdown, the highest standard deviation and the lowest Sharpe and Sortino ratios of the three models listed. Thus buy-and-hold VSMGX would be the highest risk investment of the three; even a static investment of 60% SPDR S&P 500 ETF (SPY) and 40% Vanguard Total Bond Market ETF (BND) does better.
The Dynamic 60:40 MAC Model provided the highest simulated returns with the best risk measurement, and would therefore be the lower risk investment.
An additional risk consideration is that portfolios holding stock- and bond-funds should lose less during black swan events. An example is the October-November 1987 stock-market crash when the S&P 500 lost approximately 27% in a few days. Over the same period the Vanguard GNMA Fund (VFIIX) gained about 5%. A 60:40 stock-bond fund with VFIIX would have had a more tolerable loss of about 14%. Thus, it is prudent to invest in blended funds of stocks and bonds, provided one changes the investment to 100% bonds during equity down-markets.
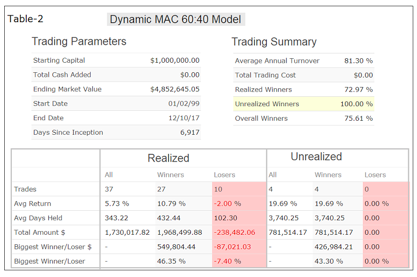
Trading effort
Very little effort is required to adjust and rebalance the stock-bond allocation of the model over time. Table 2 below shows the trading statistics for the Dynamic 60:40 MAC Model. Over a period of almost 19 years, from January 1999 to November 2017, there were only 37 realized trades, including annual rebalancing transactions. A listing of realized transactions (not reproduced here) shows that trading occurred only on 34 days over this 19-year period.
Maximum withdrawals
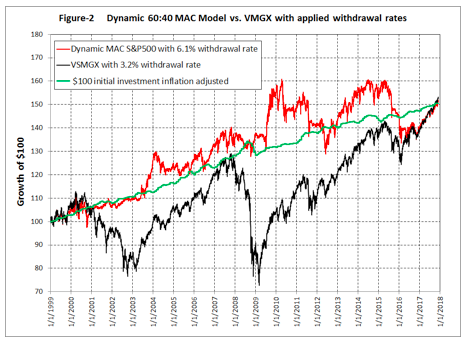
In Figure 2 below, the red graph represents the performance of the model with monthly withdrawals corresponding to a 6.1% annual withdrawal rate of the portfolio value. The black graph shows the performance of VSMGX with monthly withdrawals equivalent to a 3.2% annual withdrawal rate (which is less than the typical 4% maximum withdrawal rate in retirement).
From January 1999 to November 2017 the average annual inflation rate was 2.17%. Thus, an initial investment of $1,000,000 would have needed to rise to approximately $1,500,000 by the end of November 2017 to keep pace with inflation. The green graph shows the value of an initial investment of $100 inflation adjusted over time.
All three graphs have the same values at the start and at the end dates. However, people drawing money from a VSMGX investment would probably not have been too happy with the 32% and 44% drawdowns in 2002 and 2009, respectively, and would have had cause for concern of running out of money, because for most of the time their investment value after withdrawals was below the inflation adjusted initial investment amount, as is evident from Figure 2.
The Dynamic MAC S&P500 portfolio value after withdrawals was higher than the real value of the initial investment most of the time and suffered only a 23% maximum drawdown in 2012.
Analyses show that from a $1 million initial VSMGX investment made in January 1999 one could have withdrawn on average a real $2,420 per month for almost 19 years without depleting the portfolio and have a real $1 million left at the end of November 2017. The maximum allowable yearly withdrawal rate would have been 3.2% of the portfolio value. For 2017 the actual monthly withdrawal amount would have been about $4,000, and for 2009 about $2400.
The comparable average monthly withdrawal amount from the Dynamic 60:40 MAC Model would have been a real $5,480, which equates to a maximum withdrawal rate of 6.1% per year of the portfolio value. The actual monthly withdrawal amount during 2017 would have been about $7,700, and for 2009 about $7300.
Thus a dynamic bond-stock allocation strategy based on market climate provides a lower risk, higher and more stable income for retirees than what a static bond-stock investment can produce.
Conclusion
Investors should heed the warning of Vanguard’s founder, Jack Bogle, and prepare for low returns of about 3.5% per year over the next decade, which are expected by him from passively holding such funds as the Vanguard LifeStrategy Funds and Target-Date Retirement Funds.
Blended 60% stock and 40% bond portfolios provided a return of about 5.5% over the last 19 years. This would have increased to about 8.7% with the dynamic asset allocation strategy described here. If over the next decade returns from blended portfolios are as low as 3.5%, then the return could probably be increased to about 5.5% by applying my strategy.
My model shows that with very little effort one can improve returns significantly over the longer-term by switching to 100% bonds during down-market periods, easily identified by a simple 50-200 day moving-average-crossover system of the S&P 500, a dataset available to all.
Georg Vrba is a professional engineer who has been a consulting engineer for many years. In his opinion, mathematical models provide better guidance to market direction than financial "experts." He has developed financial models for the stock market, the bond market, yield curve, gold, silver and recession prediction, which are updated weekly or monthly at http://imarketsignals.com/. Georg can be reached at [email protected].
1 Slippage is the difference between the closing prices and the actual transaction prices one would pay or receive in real life, expressed as a percentage of the closing prices. The assumption is that one would always get a bit less than the closing prices for sell transactions, or pay a bit more for buy transactions.
Read more articles by Georg Vrba, P.E