Advisor Perspectives welcomes guest contributions. The views presented here do not necessarily represent those of Advisor Perspectives.
This is part two of a two-part series. Part one, Credit, Finance and Market Stability, was published on July 5.
In my previous article, I examined why regime-based strategies should incorporate financial-stability considerations, despite the decision by mainstream macroeconomic models to ignore these (so-called “black swan”) risks. From an investment perspective, mainstream macroeconomic models (measures of GDP growth and inflation) are too narrowly defined and thus missed the 2007-2008 crisis. Many investors have twice lost 40% of their portfolios since 2000.
From an investment standpoint, those risks deserve our attention.
My motto is “better not to lose capital in the first place.” Once a portfolio has fallen by 40%, it must generate a return of 67% just to get back to even. I will illustrate how a regime-based framework can protect capital when markets deteriorate, while adding value when conditions improve. Building this framework requires that we understand how macroeconomic and financial stability risk interact. This challenge has become increasingly important since financial markets were liberalized and deregulated beginning in the 1980s.
Building a regime-based investment framework
To build a regime-based framework, we must first identify relevant data series that correlate with the macro-financial cycle. Rigorous statistical and quantitative methods can then be used to identify distinct market regimes based on these factors. In developing a regime-based framework, we can group macroeconomic and financial data series into five categories: (1) market sentiment, (2) interest rates, (3) private-sector balance sheets, (4) real economic factors, and (5) asset prices. I will apply a statistical process to the selected data series that generate a regime-framework.
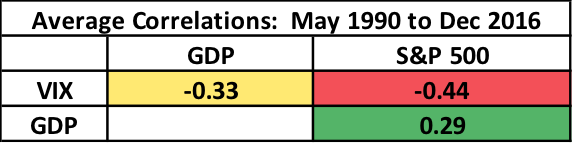
I can illustrate the intuition behind this process by using a simplified example (see the chart below) that consists of three data series: (1) GDP, (2) VIX and (3) S&P 500. The chart below standardizes and plots quarterly data for GDP growth and the VIX, and uses actual returns for the S&P 500.

In the above chart, when GDP growth is strongly positive and the “fear index” (VIX) is declining (e.g., in 2003-2004), the S&P 500 index tends to increase in value. Conversely, when the VIX increases and GDP growth slows (most notably during the 2008 crisis), the S&P 500 declines in value. My framework is designed to adapt to changes in market conditions. Average quarterly correlations between the three variables throughout the 37-year period are provided in the table below (keeping in mind that correlations are not stable, which explains my preference for an adaptive regime-based framework):
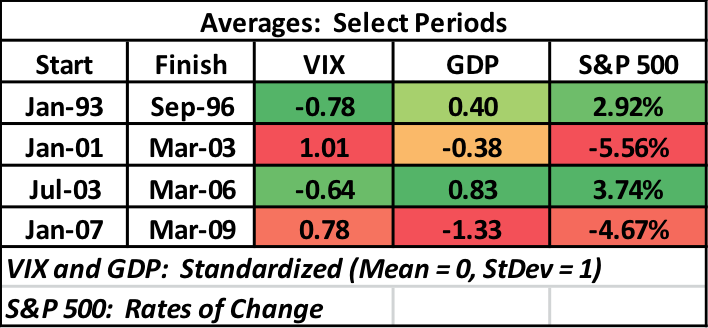
Let’s examine the behavior of the three data series in the table below for the following periods:
-
Boom: April 1993 to September 1996
-
Tech Bubble/Recession: January 2001 to March 2003
-
Housing Boom: July 2003 to March 2006
-
Great Financial Crisis: January 2007 to March 2009
Based on this presentation (in practice, I use more than a dozen data series out of a possible total of more than 100), I utilize a statistical process to identify distinct regimes. What is important in building this framework is to select appropriate data (that properly incorporates real-world macroeconomic and financial-stability risk). It is important to conduct backtests to determine that the regimes are, indeed, distinct. If they are not or if the data is not properly specified, the portfolios for each regime will not be sufficiently differentiated. I determine whether they are or not appropriate via extensive backtesting and Monte Carlo simulations.
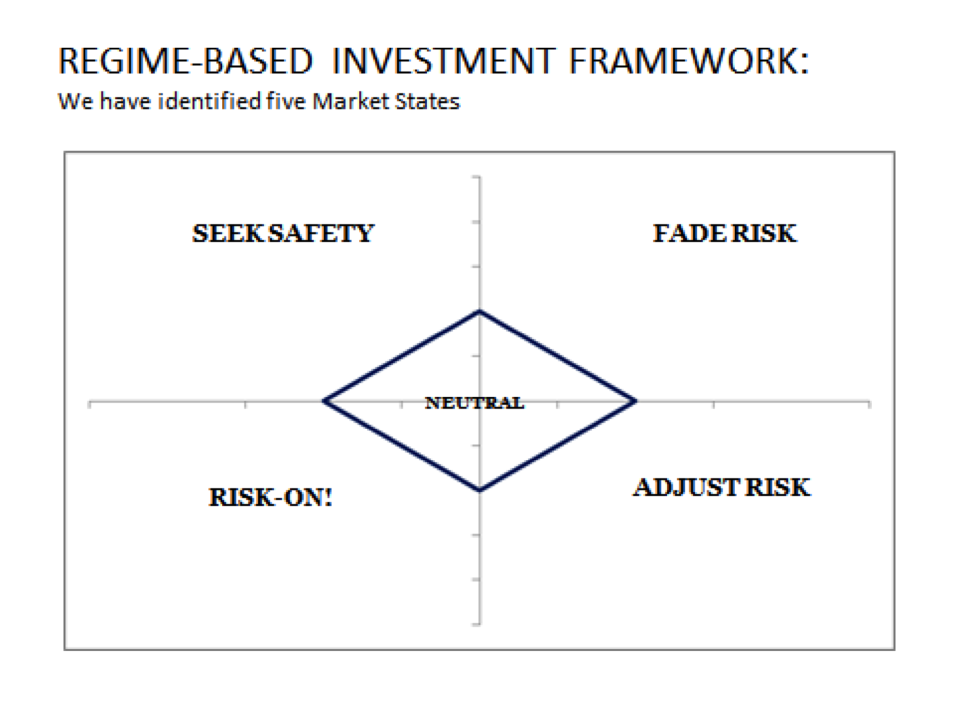
This process generates five regimes (see diagram below).
-
Seeking Safety: when markets are in this regime, invest in risk-free and low-risk assets, such as US Treasury bonds, cash and, for protection against broader systemic threats (financial systems or currencies), gold.
-
Risk-On: traditionally, this follows a crisis and/or recession and is an optimal time to increase risk-taking. This regime evolved following both the tech bubble/recession in 2000 to 2002, and the financial crisis in 2008. In backtests, our framework moved into this regime in March 2009.
-
Adjust Risk: as the financial cycle matures, there is a need to make adjustments in the allocation. In this regime, the portfolio composition tends to lighten up on REITS, high-yield bonds and emerging debt and increase allocations to global equities and commodities.
-
Fade Risk: The financial cycle tends to show signs of weakness ahead of a slowdown. In this phase, my allocation shifts to a less aggressive portfolio with increased allocations to REITS and cash and a reduced allocation to commodities.
-
Neutral: In this regime, my allocation is balanced across the various asset classes with an allocation to cash, as well.
In backtests, I apply this framework to multi-asset and equity-sector-rotation portfolios, each of which consists of 10 ETFs. The backtests were run on a combination of index and ETF returns from 1990 using data (to the extent available) that dated from 1980. In terms of my allocation process, originally I used a mean-variance optimization process, but over time determined that a simpler process, one that allocates according to Sharpe ratios (risk-adjusted returns over cash), generated better returns (I prefer simplicity, wherever possible). I allocate the portfolio to those asset classes that have performed well historically in a specific regime, while adjusting the Sharpe Ratios for current versus historical valuations.
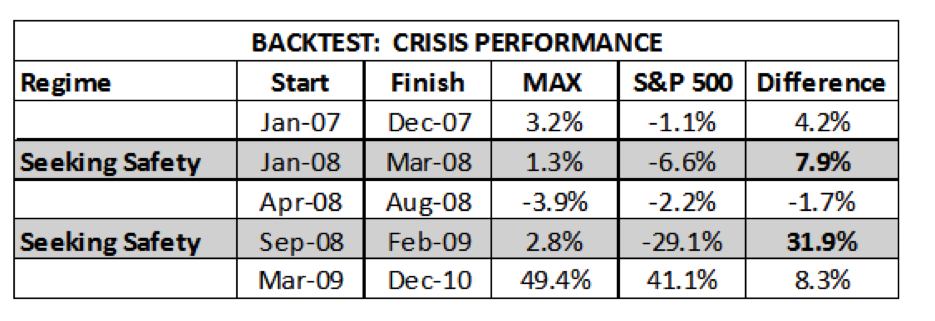
This framework is designed to preserve capital when market conditions deteriorate significantly, and to participate in upside market movements. The objective is to exit markets when conditions deteriorate significantly, but not to remain on the sidelines for too long, unlike many investors who did exactly the opposite, namely liquidating in March 2009 and then remaining on the sidelines for several years. A summary of my backtest results in and around the crisis in 2008 (including all regime-based variables and the ten asset classes) is provided in the table below. My sample portfolio results are in the column labeled MAX.
The costs of potential “false positives” (where action is taken though none is needed) are relatively small over time and are dwarfed by the savings obtained by avoiding major downturns. Once financial stability risks are incorporated into a regime-based framework, crises need no longer be viewed as “Black Swans.”
Conclusion
It is possible to design a regime-based framework that captures the real-world interaction between macroeconomic and financial-stability risk. This process can be defined to reduce losses when markets are severely stressed, and to add incremental value when markets are improving. One advantage of this framework, in comparison with alternative approaches, is that it removes the role of emotions (and the tendency to “buy high, sell low”). It provides a sensible approach in today’s highly uncertain markets.
John Balder is a co-founder and CIO at Investment Cycle Engine, Inc. His experience combines more than twenty-five years of work building innovative investment strategies at firms that include GMO and SSgA. He previously worked with the US Treasury and Federal Reserve Bank of New York after beginning his career with the House Banking Committee on Capitol Hill. His research has focused on the topic of financial stability and the real world relationship between economics and finance. More information is available at www.icycleengine.com.
Read more articles by John Balder