The Rise of Passive and Indexed Investing, and its Effect on Market and Liquidity Risk
Membership required
Membership is now required to use this feature. To learn more:
View Membership BenefitsAdvisor Perspectives welcomes guest contributions. The views presented here do not necessarily represent those of Advisor Perspectives.
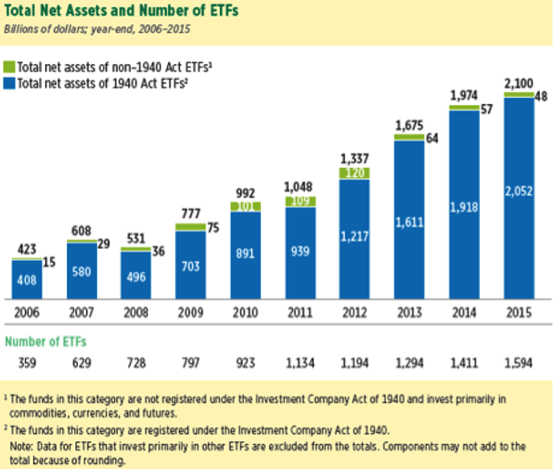
The most profound developments in the investment markets in the last 20 years have been the growth of indexed-based investing and the move to passive fund management. Though the assets of mutual funds have increased three-fold in the last 17 years, the assets of exchange traded funds (ETFs), funds that are typically indexed, have grown 130-fold.[1]
The growth is not just in ETFs. Index mutual funds have grown in assets over this same period six-fold.[2] Index funds make up 22% of all mutual fund assets currently.[3] In contrast, in 1994 index net flows (purchases) were only 2% of all net new cash in domestic equity funds.[4] For every $1.00 that has abandoned actively managed domestic equity mutual funds since 2007, $1.20 has gone into domestic equity index funds and ETFs.[5]
Investment Company Institute. 2016. 2016 Investment Company Fact Book: A Review of Trends and Activities in the US Investment Company Industry. Washington, DC: Investment Company Institute. Available at www.icifactbook.org.
Within the last 10 months we have achieved a trifecta in trillion dollar milestones: April 2016 – ETF assets reached $3 trillion, October 2016 – Blackrock assets reached $5 trillion, February 2017 – Vanguard assets reached $4 trillion.
This dramatic growth offers significant opportunity for the index fund industry, but not without its risks. As assets move from active to passive management, what systemic danger lurks? What market disruptions might occur with a concentration of assets backed by monolithic indexes on autopilot? Are there liquidity risks? Are the risks safely contained within financial services, and, more specifically, the investment industry? Or, is this a ubiquitous risk that could threaten your company, and indeed the entire economy? Could this hyper-growth portend a market failure as broad and damaging as the financial crisis of 2007-2008?
Perhaps because of the inchoate nature of the index-growth phenomenon, market watchers have expressed a wide variety of opinions from “not an issue,” to an intriguing Sanford Bernstein & Co. report that warned “passive investing is worse than Marxism.”
The battle has many fronts, and no resolution.
Active or passive management
The dispute starts with the structure and returns of indexed mutual funds and ETFs, and differences with active management. Indexing is the rote emulation of a fixed benchmark; active management is the attempt to outperform the benchmark with superior securities selection or timing. There have been winners on both sides, but the evidence is that indexing in the aggregate has outperformed active management.
Data from the S&P Indices versus Active U.S. Scorecard (SPIVA®), which has been published for 14 years, shows in detail the fortunes of active managers against their benchmarks. “(O)ver the 10-year investment horizon, 85.36% of large-cap managers, 91.27% of mid-cap managers, and 90.75% of small-cap managers failed to outperform (their benchmarks) on a relative basis.”[6] The same underperformance held for active fixed-income managers, though they generally performed better against their benchmarks than active equity fund managers.
Studies from Morningstar Inc,[7] and BNP Paribas[8] have shown similar results. Generally, for long periods, index investing has outperformed active investing in total returns after costs. However, investment advisors still build the case for active management when they use managers who have shown superior performance over long periods – and there are many – who invest in areas that indexes have not yet reached, or cite the value-added benefits from active managers for their research and other services. With the explosive growth of indexing, the concern remains; How will the securities markets behave if it is one day predominantly driven by automatic purchases and sales tied to the fixed rules of similar indexes?
Concentration risk and co-movement
A persistent argument against indexing is that mass movement of assets in and out of the S&P 500 – the most commonly followed index – could cause concentration risk, price co-movement and higher correlations. The problem, should this occur, is that the advantages of diversification disappear. When unsystematic risk, also known as diversifiable risk, can no longer be managed then one is at the mercy of the markets.
The bleak vision is a science fiction scenario where indexes are a virtual Skynet (from the Terminator movie), and the internet-based neuro-conscious artificial intelligence software takes over the national defense grid. Skynet then turns its fire power against humans. Likewise, says the index-wary camp, our 401(k) plans can fall to the mercy of forces beyond human control, or indexes.
As silly as this analogy is, consider this. “There is over $7.8 trillion benchmarked to the (S&P 500) index, with index assets comprising approximately $2.2 trillion of this total.”[9] The total U.S. stock market valuation is $26 trillion. Is it unreasonable to question the potential unruly market effect if 10% of the total U.S. market moved in lockstep? Could a “run” on just the top 10 companies (that comprise 20% of the total value of the S&P 500) cause the S&P 500 to collapse, and the broader market with it?
James X. Xiong calls this “trading commonality,”[10] a risk that reaches to the depths of systematic risk, which is non-diversifiable or market risk. “Many stocks within an index being traded are simultaneously bought and sold. Consequently, the stocks in an index tend to move together throughout the trading day.” Because of this and because institutional ownership has increased so substantially there has been a convergence of betas (stocks’ sensitivity to market changes) since 1997, which means that stocks are essentially trading together. Xiong concludes: “Though perhaps not the only explanation for rising systematic risk, our results provide strong evidence that the observed increase in trading commonality since 1997 has indeed led to lower cross-sectional dispersion of volume changes and, therefore, greater systematic risk since then.”
Craig Israelsen might agree. “It’s clear that correlations migrated upwards around the end of 2008, and stayed higher for a period afterward. But, in recent years the correlations are beginning to reduce. However, the correlation between U.S. mid cap, U.S. small cap, and EAFE (non-US developed companies) with the S&P 500 continues to stay fairly high…the notion that increased passive investing may lead to heightened correlations is reasonable. All the more reason to diversify beyond the normal asset classes.”[11]
Fortunately, a normal asset class like the S&P 500 is not the only index. Indexing has been a beneficiary of its own success. “We now have the bizarre situation that there are more indices than there are large cap stocks, this is not at all helpful for investors,”[12] wrote Inigo Fraser-Jenkins, senior analyst, Sanford Bernstein.
Index fatigue indeed may not be helpful for investors, but the dilution effect of many competing indexes and strategies is. Though the S&P 500 is the dominant index in the U.S., the fastest growing segment in the ETF industry is so called smart beta. These are ETFs with various factor tilts (preferences) to value, yield, quality, momentum, low-volatility or some other perceived attractive investment feature. There are some 800 of these now – which is nearly 20% of the global number of ETF issues. In asset values the number is far lower than 20%. None-the-less, the S&P 500 may be reaching a saturation point. It will likely never have the imperial effect on the market that some perceive. As an illustration of this, though the chart below is titled “Total Net Assets of ETFs Were Concentrated in Large-Cap Domestic Stocks” the aggregate dollar value in the other nine categories is almost 3 times those of Large-cap Domestic (S&P 500).[13] Additionally, the percentage of mutual funds that are indexed to the S&P 500 has fallen from 71% to 31% in the 15-year period ending 2015.[14]

Investment Company Institute. 2016. 2016 Investment Company Fact Book: A Review of Trends and Activities in the US Investment Company Industry. Washington, DC: Investment Company Institute. Available at www.icifactbook.org.
John Bogle, the founder of The Vanguard Group and creator of the first index fund, focusses his worry not on traditional index funds (or what he calls ”TIFs”), but on ETFs. Bogle said no to Nate Most, the developer of the ETF, when Most brought his innovative product idea to Vanguard. Bogle’s concern was that ETFs with their ready liquidity would introduce excessive trading to an otherwise long-term buy and hold asset – the index fund. (Vanguard later entered the ETF business.) Still, Bogle’s prediction about trading was correct. He recently wrote: “ETFs’ impact on stock trading has reached mammoth proportions. They account for nearly one-half of all trading in US stocks. So far in 2016, the dollar volume of trading in the 100 largest ETFs has totaled $13.0tn. Trading in the stocks of the 100 largest US corporations totaled $13.9tn, only slightly larger. But the $1.6tn market capitalization of those ETFs is but a small fraction of the $12.8tn for those corporate stocks. As a result, the annualized turnover rates are different in magnitude: stock turnover, 120 per cent; ETF turnover, 880 per cent. The implications of this rapid trading – call it speculation – have yet to be fully examined.”[15]
Related to Bogle’s warnings, in a recent S&P Capital IQ research piece the authors spoke of “liquidity fragility.” They used as an example stocks in the S&P 500. In the period they examined, ExxonMobil’s market size represented 1.91% of the total S&P 500 index, while the much smaller market size Netflix represented only .22% of the index. However, the percentage dollar trading value was far different. ExxonMobil was only .78% of the index and Netflix was 1.73% of the index. By this measure, Netflix, though a much smaller company, was more liquid than ExxonMobil. Since ExxonMobil was relatively less liquid than Netflix, but was forced into share purchases and redemptions at almost nine times the rate of Netflix (1.91% / .22%) this can cause temporary price shocks. The authors concluded, “A structural problem may arise when the liquidity demanded by the ETF exceeds the liquidity available of some of the underlying holdings…Thus, an ETF’s impact of buying and selling will be most meaningful on those stocks that are most volatile and least liquid.”[16]
A way to visualize this is by comparing traders for active and passive funds. The active manager, knowing that he wishes to accumulate a stock, checks the price, the high and low for the day, its volume of shares traded, the ex-dividend date, any market news and a variety of other indicators to get a sense of how much market impact his trade could make. He then purchases. In contrast, the index fund or ETF manager has a mandate and must purchase or sell indiscriminately shares in the percentage of their proportion to the underlying index. Though an index manager can stage purchases over time, what he buys or sells, and at what amounts, is fixed, like a bullet train speeding down a light-rail track. This monolithic force will only grow with the proliferation of indexed investing.
Price discovery and allocation of capital
Related to this is the fundamental concern that price discovery and effective allocation of capital is steamrolled by the auto-pilot and market-blind prerogatives of indexing. Active managers extoll their relative value against indexing through the virtues of price discovery and their effective allocation of capital into overlooked, long lead-time and promising industries. They describe it as a social good. The Sanford Bernstein report argued a persuasive case for the contributions that active managers make.
Indexers take an opposite approach. John Bogle calls the concept of allocation of capital “nonsense.” Said Bogle, “The stock market has nothing – n-o-t-h-i-n-g – to do with the allocation of capital. All it means is that if you’re buying General Motors stock, say, someone else is selling it to you. Capital isn’t allocated – the ownership just changes. I may be an investor, you may be a speculator. But no capital goes anywhere. This is basically a closed system.”[17]
Tell CALPERS they are not allocating their $300 billion pension fund. Tell Japan’s $1.2 trillion Government Pension Investment Fund they are not allocating capital. If money was not allocated stock prices would never move because in Bogle’s “closed system” supply and demand would always be equal.
However, the Sanford Bernstein report builds carefully the case that active managers do more than simply buy what others are willing to sell, by investing capital in longer-term timeframes than the index investor would typically choose. They offer the mining industry as an example: “It stands both as the most capital intensive of all activities in the developed world and also as the ultimate origin of all the physical capital that, via the process of capital accumulation highlighted by Marx, stands as the basis of the wealth of nations.”[18] With huge startup costs and three to six-year lead times on cost recovery, mining as an investment may not capture much attention for the average fund holder who holds his fund only three years, as industry statistics would indicate. Nevertheless, the need to finance such long-term, capital-intensive economic activity is vital for the growth of a modern economy. Index funds would only be invested in such an enterprise by market weight or as a factor tilt. You could say that an index could be created that would early invest in promising companies, but in as much as new ETFs and index funds are often sold on hypothetical back-tests of their underlying indexes, the planned investments would already have to be paying off, so to speak, to be included. In this way indexing is “backward looking” and is last dollar in, not first dollar in. This, to some active managers is a sort of free-ride on the back of the market and does not contribute to capital formation. The dearth of new IPO issues in recent years may be proof of this claim.
Bogle might counter that active managers are not really seeking price discovery; they (long-only managers) are simply seeking higher prices. They are not trying to find out how much a stock is worth, they are trying to find out if it is worth more than the price it is currently trading at. Fritz Meyer, former Invesco primary economic and markets analyst, may be closest to the mark when he said “prices are set at the margins.”[19] This reality makes price discovery relative, not absolute, in that active managers are not discovering or setting prices they are simply affecting price changes the same way retail investors are – by buying and selling.
However, price discovery may be an unavoidable goal even with index investors. The additions eligibility criteria for the S&P 500 are: company must be U.S. domicile with a market cap of at least $5.3 billion. At least 50% of its float must be available to the public. The ratio of annual dollar value traded to float-adjusted market capitalization should be 1.00 or greater, and the stock should trade a minimum of 250,000 shares in each of the six months leading up to the evaluation date. Finally, the sum of the four most recent consecutive quarters must show positive earnings.[20] This is a form of price discovery.
Disruptions to the price discovery function may be multiplied in fixed income. When sub-investment grade bonds are indiscriminately bought into an index, and then into the public fund that mirrors the index, shareholders may suffer. It can also erupt to systemic dangers if the market finds itself over-weighted in significantly worse paper than thought. These were the conditions that ignited the sub-prime mortgage meltdown in the U.S. Advisors may regret trading their credit analysts (active management) for quants (passive management) if junk bond prices, for example, gap down for inexplicable reasons.
Meanwhile, indiscriminate purchases of shares of stocks that are found in indexes has been surprisingly disorderly even at low levels of penetration. Frank Gannon, co-chief investment officer at Royce & Associates, said, “The two most significant factors in the current market cycle (4th quarter of 2015), have been the Fed’s quantitative easing and the growth of passive investing. These have worked together to benefit weaker companies that are often laden with debt and bereft of earnings. Currently, roughly one-third of all the companies in the Russell 2000, are not earning any money, the highest percentage of non-earners in the history of the index.”[21] These are price distortions and an enemy to the shrewd investor. Will they eventually be an enemy to the markets?
However, this is good news for those who invest in past performance. Clearly index investors have of late won the performance battle. It would be difficult to find grieving index investors in what is now the 95th month of the 2nd longest bull market in history. If the sky is falling, it hasn’t fallen far. Still, as risk managers it pays to know that there could be significant risk embedded in index funds. Professor Jeffrey Wurgler noted “in the October 1987 market crash, stocks that were members of the big indexes dropped 7% more than non-index stocks. I won’t be surprised if we see more of this sort of thing.”[22] The risk is that capital in a passively managed world trails opportunity instead of creates opportunity. One wonders, though, how active managers would defend the 1999 “tech bubble.” If this was an exercise in price discovery and effective allocation of capital, it was a fail. Consequently, there is no clear winner in this debate.
Fails and shorts
Much has been written about “Fails to deliver (or receive)” or simply fails. Securities generally have three business days to settle (pay for) transactions after the trade or, or T+3 as the industry calls it. A controversial report was published by the Kauffman Foundation in March 2011 with a self-explanatory title: “Canaries in the Coal Mine: How the Rise in Settlement ‘Fails’ Creates Systemic Risk for Financial Firms and Investors.” The authors write, “Our central conclusion is this: Every fail introduces a cumulative and potentially compounding liquidity risk into the orderly process of settling the [then] $7.5 trillion of security transactions completed each day, which could be especially dangerous during times when financial institutions are short of liquidity [as was true during the financial crisis of 2008.]”[23]
The report was unfairly derided by the ETF industry as an alarmist piece from meddling outsiders. However, the problem has not gone away. Three years later, an internal analysis of fails-to-deliver data from Mohit Bajaj, Director, ETF Trading Solutions, at WallachBeth Capital, a New York based institutional execution services firm, showed that ETFs were a startling 68.28% of the fails for all securities. Bajaj says this “…still happens, especially on certain times of the year [i.e., when an ETF goes ex-dividend], shares tend to get locked up.” Further, with the introduction of shorter settlement to T+2 on September 5, 2017 he says, “It will just increase the amount of fails in the market place.“[24]
Again, though, as with so much in the active/passive debate the subject of fails is not settled science. Georgetown professor James Angel, a specialist in structure and regulation of financial markets around the world, a vocal critic of market risk, is not worried about ETF settlement fails. “Of all the things to worry about in equity market structure, I would put [failed ETF trades] not at the bottom but well down the list.”[25]
Another embedded risk to ETFs (or any stocks) is short positions. If you are long a stock, it means you own it and generally expect its price to increase. If you are short a stock, it means you have sold it in hopes that the price will drop. Short interest is often an indicator that the stock market is poised to drop or is dropping. As of February 9, there was only one ETF on the top 50 short-interest list, no ETFs in the top 50 for shorts as percentage of float, or in the top 50 in days to cover.[26]
Feedback loops and exogenous shocks
Some warn that indexes might be approaching “bubble” proportions due to price distortions that are hard to explain. For example, S&P Capital IQ, discovered that as of Dec. 31, 2015, stocks in the Russell 2000 traded (as measured by price-to-book ratio) at a 61.9% premium to stocks that were not in the index. This is up from 12% in 2006.[27] Jeffrey Wurgler wrote, “The evidence says that stock prices increasingly depend not just on fundamentals but also on the happenstance of index membership.”[28] An example given was J.B. Hunt Transport and Swift Transportation – both, trucking companies. J.B. Hunt is in the S&P 500, and Swift Transportation is not. The price to book of J.B. Hunt was 8.1 on February 10, 2017, while the price to book of Swift Transportation was 5.2. In the last five years both stocks have doubled in price. Though there are certainly many reasons why there are differences in numbers having nothing to do with index membership, price to book discrepancy is a recurring trend.
In a separate report Wurgler states that, “indices are no longer mere carriers of information, but that they and their associated index-linked investing strategies have become so popular that they are generating new stock market phenomena in their own…these all stem from the finite ability of stock markets to absorb index-shaped demands for stocks.”[29] He speaks of the “index effect” where individual stock performance has been shown to increase simply by inclusion in a major index. This may not be problematic on the way up, but such a feedback loop, which has also been observed by other market watchers, could intensify a downturn, such as what happened in the intra-day flash crash May 6, 2010.
“The scenario is generally expressed as follows: An exogenous shock produces a stock market decline; that price decline triggers futures selling by portfolio insurers; such futures selling produces an undervaluing of the futures contract relative to the cash index; stock index arbitrageurs buy the relatively underpriced futures and sell the relatively overvalued stocks; stock prices fall further; declining stock prices induce additional selling by portfolio insurers; and the process begins anew…The flash crash of May 6, 2010 is again drawing attention to an index-based product….The story goes that a negative shock to S&P 500 prices or demand led to a large intraday price decline that was exacerbated by further selling in the futures, and so on. If this is correct, the basic mechanisms that played a role in the October 1987 crash seem to still be here twenty-three years later. To be clear, these stories hardly suggest that the world would be better off without index derivatives. They just raise the question how differently these episodes would have unfolded in a counterfactual world in which trading in index members would be limited to their floating shares outstanding.”[30] Wurgler concludes wryly, “Indices and index-based investing are innovations that are here to stay and have rightly become central to modern investing. The consequences are here to stay as well.”[31]
Margin balances, bankruptcies, and illiquidity
It is imperative to evaluate risk at such advanced stages of a bull market. We should be reminded that the market does not just go down. The market never collapses by itself; it is tripped. And in many cases in recent history the trip was index or derivatives related (Flash Crashes of May 2010 and August 2015, collapse of October 1987, etc.).
Specific to our topic of potential risks with indexed investing is the detail that an ETF has a market price and a Net Asset Value (NAV), as opposed to a mutual fund that has only a NAV. This indicates that an ETF is materially different from a mutual fund. The two prices for an ETF suggest a derivative nature. It is this difference and the arbitrage opportunity between the NAV and the market price, which is a core of the angst that some older market participants share about ETFs. And, most ETFs are optionable; mutual funds are not. This magnifies speculative opportunities and risks.
A few weeks after over 20% of all US-listed ETFs were forced to stop trading on August 24, 2015, the Securities and Exchange Commission (SEC) commissioner Luis Aguilar, asked, “Should we consider curtailing the growth of ETFs?”[32] ETF issuers called this collapse an equities problem, as NYSE trading halts failed. Equities traders called it an ETF problem, and cited the disproportionate number of ETF collapses. Claiming that the 2010 or 2015 collapses were an equities fail, not an ETF fail, is like blaming the driver in front of you for slamming on his breaks while you were tailgating. Who caused the crash? The frustration for market watchers is that we sense that there are potentially lethal connections between these various components but fear that when we see how they behave under extreme stress it will be too late.
Is the explosive growth and unique nature of ETFs a virtual housing bubble? Is it too early to ask? Housing prices peaked fourth-quarter 2006 for the bellwether markets of California and Florida.[33] This was many months before the downturn. The price drop was difficult to predict because prices had been raising inflation adjusted since the mid-1980s. We were in a long-term bull market in housing, much as we are now in a long-term bull market in stocks.
The Great Recession was a crisis in finance on a large scale. It went far beyond the fortunes of individual investors and homeowners. When we compare business and personal bankruptcies[34] against recessions since 1980[35] we find that surprisingly, the Great Recession from Dec 2007 – June 2009 did not bring with it the spike in personal bankruptcies that one would expect. More bankruptcies? Yes. Dramatically more? No. Instead, what was unique about the Great Recession, in post-depression times, was the collapse of so many large financial institutions: Bear Stearns, Fannie Mae, Freddie Mac, Lehman Brothers, CitiBank, AIG, Merrill Lynch, Countrywide Mortgage, and the spill over effect to the U.S. itself with a first ever downgrade of its debt in August 2011. This is what a major economic downfall looks like. It starts in finance, the very subject of our discussion, but it meets in the middle, much as Freddie Mac met the foreclosed homeowner in the middle, and accelerated each’s demise.
Another indicator may be the run-up of margin debt as percentage of margin credit balances. For the last 2 years, this ratio of leverage is resting at its highest level since 2000 according to NYSE Market Data.[36] A significant market drop could prompt margin calls that would force more selling and lower prices. Margin debt, fails, price anomalies between stocks inside indexes against those outside of indexes, trading commonality, ETF turnover, feedback loops – all issues that give risk managers pause.
Direct business risks and governance drift
If you are not persuaded by market risk implications, perhaps you will find industry specific arguments against indexing more compelling and worrisome. Among these is the concern that the mass movement of stocks managed by index funds are effecting the underlying businesses themselves. Two examples given are airlines and banks. Writer James Ledbetter reviews a study by Harvard University law professor Einer Elhauge, which found that index-fund ownership had a negative effect on the airline industry. “Index funds, such as Vanguard and Fidelity, are playing an outsized role in the sector, and that their rapid adoption is accelerating ownership concentration, resulting in higher prices for travelers.”[37]
Evidence, however, does not support his claim. U.S. Department of Transportation statistics show that airline prices have dropped overall in the last 20 years by 25% in inflation-adjusted terms.[38]
Additionally, a University of Michigan business-school study “demonstrated that banks whose shares are often packaged in index funds tend to offer higher fees and rates for such services as account maintenance and deposit certificates than banks whose stocks are rarely or never included in index funds. The reason, the authors surmise, is that ownership by index funds gives banks an incentive to behave more as if they have a common owner. The reduced sense of competition leads the banks to charge consumers more.”[39]
Reduced sense of competition is an odd claim. Businesses either compete or do not, but prices are not based on something as subjective as a sense. More importantly, comparing community banks that do not have enough size, float, or liquidity to be included in an index, to much larger banking institutions in bigger markets that have significantly higher costs and offer more services to their customers, is an unlike comparison.
Ledbetter’s prescribed fixes for these theoretical offenses are two-fold. Find ways to “index stocks that rely on some other factor besides sheer market capitalization (for example, using some measurement of a stock’s value, such as a price-to-earnings ratio).” This is what smart beta does, the author seemed to have missed that revolution. And, force antitrust laws to “compel the large airline shareholders to alter their strategies in ways that shrink their influence” by limiting “holdings in only one company per sector, or agree to purchase only non-voting stock, which would leave them with less impact on company management.”[40] Such draconian measures are presumptuous at least and introduce even greater risks at most. If increasing accountability and responsibility are the goals, limiting voting rights is not the solution.
Finally, voting rights and responsibilities is another area where active and passive managers are divided. Shareholders of common stock exercise voting rights either directly at the annual shareholders meeting or by proxy. Shareholders can vote for board members, major corporate changes, proposed mergers, acquisitions, or even stock splits. In some cases shareholders may vote on executive compensation, options grants or other administrative matters. Mutual fund managers are “shareholders of record” and vote proxies for their clients. Active managers usually are more involved in voting than passive (index) managers. Active managers have a vested interest in the underlying company and specific goals for it. They own shares voluntarily, whereas index managers own their shares by model default. And, active managers usually own fewer securities than an index fund or ETF (the average number of holdings in a mutual fund is only 90 [41]), which makes it easier to vote proxies.
Active fund managers are often critical of the relationship that index fund managers have with the management of their holdings. They believe that index fund managers fail in their obligations to the underlying shareholders to the companies they hold, and the consequences could be grave. Blackrock, StateStreet, and Vanguard (the largest index fund managers) alone control 12% of all proxy votes, yet they are rarely activist shareholders.[42] Charlie Munger, vice chairman of Berkshire Hathaway, thus warned about the rise of index funds. He said recently “Index funds will be permanent owners who can never sell. That will give them power they are not likely to use well.”[43] Legendary active investor Mario Gabelli might agree. “He thinks passive investors weaken governance because index funds don’t vote proxies often enough or pressure management to improve. Passive funds are destroying the notion of investing.”[44]
However, activism has its limits, even for committed active investors. Charlie Munger recently remarked on the trend away from insular boards to activist investors, “I like the new system even less ... Carl Icahn is a very able man but that doesn't mean he should be running the world.”[45]
Conclusion
Nothing worries risk managers more than telling them there is nothing to worry about. Whether you are worried or not, the SEC is opening a “root and branch review” of ETFs. Said an onlooker: “ETFs are growing like bunnies. It’s a great success story, but as a forward-looking regulator the SEC has to be on top of any potential issues that may arise in the future.”[46]
Additionally, in June 2015, a group of Federal Reserve Bank presidents gathered to discuss hypothetical scenarios of overheating financial markets. They were particularly interested in valuation, leverage and liquidity vulnerabilities. They published their report and it is available through the Federal Reserve Bank of New York.[47] The risk dashboard below was created from their findings. Their review will stretch into 2017. None of the risks discussed in this article were exposed in their review (besides tangentially a discussion of margin balances and equity valuations). This could mean that either the Federal Reserve Bank of New York or I am looking in the wrong direction. And that is exactly how risk surfaces. We are seldom looking in the right direction, seldom asking the right questions, seldom measuring the right things.

Macroprudential Policy: A Case Study from a Tabletop Exercise, FRBNY Economic Policy Review, June 2015
As I mentioned the stock market never falls; it is tripped. The question is what will trip it. Predicting the next market meltdown, or liquidity crisis, the how, the when is virtually impossible, and even harder to predict when the very people who likely will be complicit (accidentally or not) in the collapse are the ones making the predictions.
The question of whether indexing is destroying the markets is like asking whether robots will take your job. Maybe, but don’t unplug the robot. Or, the argument that the proliferation of indices is controlling the market is to some like claiming that the proliferation of thermometers is controlling the weather. It is not one index (such as the S&P 500) that is growing in influence anymore, but hundreds, even thousands of disparate, non-correlated indices.
We rarely look in the right direction so we need to look in every direction. How? Risk in the investment world is always a diversification problem. Neither Bernie Madoff, Enron, the woes of the Nikkei (which is at half the level it was 25 years ago), or indexing, are risks unto themselves. It is the investor or advisor who takes the risk by over-weighting a security, asset class, country, or strategy. Likewise, no one should manage 100% of their assets passively or actively. For effective risk management, investors and advisors should employ both. Even if you can document that passive consistently outperformed active, you should think of this fee, of sorts, as an insurance premium. I say this as a beta fund manager. This was a key takeaway from the formidable Sanford Bernstein study mentioned before.
The undertow is not so great that the red “do not swim” flags should be out. But the orange caution flags should be flying. Additionally, because of the interconnectedness of our financial system, unprecedented sovereign, corporate, and individual debt, derivatives exposure, and the weaknesses remaining in a system that has not fully recovered from the recent Great Recession, the tide could rise quickly.
Andy Martin is president of 7Twelve Advisors, LLC, a ‘40 Act fund manager, and author of Dollarlogic: A Six-Day Plan to Achieving Higher Returns by Conquering Risk, foreword by Arthur B Laffer, Ph.D. None of the information in this article should be construed as investment advice.
Notes
[1] ICI Factbook, 2016, page 9, https://www.ici.org/pdf/2016_factbook.pdf
[2] ibid, page 45, https://www.ici.org/pdf/2016_factbook.pdf
[3] ibid, page 45, https://www.ici.org/pdf/2016_factbook.pdf
[4] ICI Factbook, 2000, page 7, https://www.idc.org/pdf/2000_factbook.pdf
[5] ICI Factbook, 2016, page 47, https://www.ici.org/pdf/2016_factbook.pdf
[6] Soe, Aye M.; Poirier, Ryan, SPIVA® U.S. Scorecard, Mid-year 2016, 1, https://us.spindices.com/documents/spiva/spiva-us-mid-year-2016.pdf
[7] Johnson, Ben, Morningstar’s Active/Passive Barometer, 2015: 3-7, http://corporate.morningstar.com/US/documents/ResearchPapers/MorningstarActive-PassiveBarometerJune2015.pdf.
[8] Israelsen, Craig; Blanchett, Dave, FundQuest’s Study of Active and Passive Management, Advisor Perspectives, 2007, http://www.advisorperspectives.com/pdfs/newsltr33-1.pdf.
[9] S&P Dow Jones Indices LLC, 2016, http://us.spindices.com/indices/equity/sp-500
[10] Xiong, James X., How Index Trading Increases Market Vulnerability, Morningstar Advisor, 1/31/12, http://www.morningstar.com/advisor/t/51409655/how-index-trading-increases-market-vulnerability.htm.
[11] 12/5/16, e-mail exchange between Craig Israelsen and the author
[12] Jenkins, Inigo Fraser, The Silent Road to Serfdom: Why Passive Investing is Worse Than Marxism, 2016, August 23: 3
[13] Investment Company Institute, Investment Company Fact Book, 2016, 56th edition: 71
[14] MacBride, Elizabeth, Watch out for this $1 trillion stock bubble, CNBC QUARTERLY INVESTMENT GUIDE, Jan 14, 2016, http://www.cnbc.com/2016/01/14/watch-out-for-this-1-trillion-stock-bubble.html.
[15] Bogle, Jack: The lessons we must take from ETFs, Financial Times, 12/11/16, https://www.ft.com/content/f406d50c-bbcf-11e6-8b45-b8b81dd5d080.
[16] Pope, CFA, David, Zhao, Frank, Research Brief: Liquidity Fragility, S&P Capital IQ, July 2015
[17] Regan, Michael, Q&A With Jack Bogle: ‘We’re in the Middle of a Revolution, Bloomberg Markets, Nov 23, 2016, https://www.bloomberg.com/features/2016-jack-bogle-interview/.
[18] Jenkins, Inigo Fraser, The Silent Road to Serfdom: Why Passive Investing is Worse Than Marxism, August 23, 2016: 11.
[19] Phone call between Fritz Meyer and author, 12/5/16.
[20] S&P U.S. Indices Methodology, S&P Dow Jones Indices, November 2016: 5-6, https://us.spindices.com/documents/methodologies/methodology-sp-us-indices.pdf.
[21] Alster, Norm, The Ease of Index Funds Comes with a Risk, New York Times, October 9, 2015, http://www.nytimes.com/2015/10/11/business/mutfund/the-ease-of-index-funds-comes-with-risk.html.
[22] Ibid.
[23] Bradley, Harold; Fawls, Robert; Litan, Robert E.; and Sommers, Fred, Canaries in the Coal Mine: How the Rise in Settlement Fails Creates Systemic Risk for Financial Firms and Investors, Ewing Marion Kauffman Foundation, March 2011, 2., http://www.kauffman.org/what-we-do/research/2,011/07/canaries-in-the-coal-mine.
[24] E-mail conversation with Mohit Bajaj and the author, 12/14/16. Period examined was 2014 through June 2015.
[25] Whyte, Barry J., ETF Trade Settlement Risk Raises its Ugly Head Again, Institutional Investor, August 14, 2013, http://www.institutionalinvestor.com/Article.aspx?ArticleId=3243569#.WFBLA_ArLIU.
[26] Wall Street Journal, Market Data Center, Short Interest: Nasdaq Highlights | NYSE MKT | NYSE, accessed 2/9/17, http://online.wsj.com/mdc/public/page/2_3062-nasdaqshort-highlites.html
[27] Alster, Norm, The Ease of Index Funds Comes with a Risk, New York Times, October 9, 2015, http://www.nytimes.com/2015/10/11/business/mutfund/the-ease-of-index-funds-comes-with-risk.html.
[28] Ibid., http://www.nytimes.com/2015/10/11/business/mutfund/the-ease-of-index-funds-comes-with-risk.html
[29] Wurgler, Jeffrey, On the Economic Consequences of Index-Linked Investing,
Challenges to Business in the Twenty-First Century: The Way Forward, October 11, 2010: 2-3.
[30] Ibid., 10-11.
[31] Ibid., 20.
[32] Newlands, Chris, ETFs: everywhere but not yet a systemic risk, Financial Times, December 8, 2016, https://www.ft.com/content/59739d3a-bd60-11e6-8b45-b8b81dd5d080.
[33] Federal Reserve Bank of St Louis, https://fred.stlouisfed.org/graph/?id=NYSTHPI.
[34] Annual Business and Non-business Filings by Year (1980-2015), https://s3.amazonaws.com/abi-org/Newsroom/Bankruptcy_Statistics/Total-Business-Consumer1980-Present.pdf.
[35] US Business Cycle Expansions and Contractions, National Bureau of Economic Research, http://www.nber.org/cycles/cyclesmain.html.
[36] NYX Data, http://www.nyxdata.com/nysedata/asp/factbook/viewer_edition.asp?mode=tables&key=50&category=8.
[37] Ledbetter, James, IS PASSIVE INVESTMENT ACTIVELY HURTING THE ECONOMY? New Yorker, March 9, 2016, http://www.newyorker.com/business/currency/is-passive-investment-actively-hurting-the-economy.
[38] United States Department of Transportation, DOT Statistics, website accessed 12/14/16, http://www.rita.dot.gov/bts/sites/rita.dot.gov.bts/files/publications/national_transportation_statistics/html/table_03_19.html.
[39] Ledbetter, James, IS PASSIVE INVESTMENT ACTIVELY HURTING THE ECONOMY? New Yorker, March 9, 2016, http://www.newyorker.com/business/currency/is-passive-investment-actively-hurting-the-economy.
[40] Ibid., http://www.newyorker.com/business/currency/is-passive-investment-actively-hurting-the-economy
[41] Smith, Terry, Too many stocks spoil the portfolio, Financial Times, April 12, 2013, https://www.ft.com/content/220c76fe-a1bd-11e2-ad0c-00144feabdc0.
[42] Wathen, Jordan, A billionaire's warning on index funds, CNN Money, March 31, 2015, http://money.cnn.com/2015/03/31/investing/investing-index-funds-warning/
[43] Ibid., http://money.cnn.com/2015/03/31/investing/investing-index-funds-warning/.
[44] Segal, Julie, Active Manager Mario Gabelli and GAMCO join the ETF Craze, Institutional Investor, March 2, 2015, http://www.institutionalinvestor.com/article/3431850/asset-management-indexing-and-etfs/active-manager-mario-gabelli-and-gamco-join-the-etf-craze.html#/.WE4XWPArLIV.
[45] Notes From Charlie Munger's Daily Journal Meeting 2015, March 26, 2015, http://www.marketfolly.com/2015/03/notes-from-charlie-mungers-daily.html#ixzz4SZstaAcY
[46] Wigglesworth, Robin, SEC preparing large-scale review of exchange traded fund industry, Financial Times, October 20, 2016, https://www.ft.com/content/00196dd0-967a-11e6-a1dc-bdf38d484582.
[47] Adrian, Tobias; de Fontnouvelle, Patrick; Yang, Emily; and, Zlate, Andrei, Macroprudential Policy: A Case Study from a Tabletop Exercise, FRBNY Economic Policy Review / Forthcoming, June 2015:4. https://www.newyorkfed.org/medialibrary/media/research/epr/2016/epr_2016-adrian-macroprudential-policy.pdf?la=en.
Membership required
Membership is now required to use this feature. To learn more:
View Membership BenefitsSponsored Content
Upcoming Virtual Events View All


