Advisor Perspectives welcomes guest contributions. The views presented here do not necessarily represent those of Advisor Perspectives.
Nearly all analysts who write about the housing bubble have focused on the purchasing madness that occurred. While this is important, it overlooks the refinancing insanity of 2004-2007. This refinancing lunacy will devastate mortgage and housing markets for years to come.
You may wonder why I choose to focus on bubble era refinancing. After all, refinancing happens all the time.
Here is why: California was the nation's epicenter for the refinancing madness. During the bubble years, roughly five times as many refinanced first liens were originated there as were purchase loans.
Millions of homeowners refinanced once, twice, even three times or more while their homes soared in value. These became known as “cash-out refis,” where the borrower refinanced for a larger amount than the previous loan. A California home that may have been purchased for $200,000 in 1997 could easily have had a $600,000 refinanced loan in 2006. When home prices began to tumble, they found themselves trapped in a badly underwater property.
There were roughly 20 million homeowners who refinanced during the bubble years. At least one-third of them also had second liens on their property. When housing markets weaken, millions of them will face significant debt burdens. This horde of refinanced homes will cause the debacle of 2008-2010 to resume.
Enormity of bubble era cash-out refinancing
Cash-out refinancing caused millions of homeowners to lose their property. The owner cashed out the growing value of the house by taking out a mortgage larger than the previous one and pocketing the difference. Hence, many of these borrowers ended up with mortgages much larger than their original one.
Refinancing started in 2003 after the Fed began lowering interest rates. Approximately 15 million mortgages were refinanced that year for a total of $2.5 trillion. Cash-out refinances were relatively modest that year because the housing market bubble had just begun.
Things began to heat up in 2004. Numerous major metros were showing double-digit home-price increases with the hottest ones sporting gains of 30% or more. Speculative fever spread throughout the nation. The urge to tap this growing equity with a cash-out refinance was met by accommodating lenders who lowered underwriting standards and accepted loose appraisals. According to Freddie Mac, roughly 46% of all homeowners who refinanced in 2004 pulled money out of their refinanced mortgages. This soared to 61% by the third quarter of 2004.
Rising interest rates in 2005 did not prevent homeowners from using their increasingly valuable houses as a piggy bank. Roughly 72% of all homeowners who refinanced that year pulled cash out of their homes to the tune of $262 billion. Cash-out refinancing peaked in 2006 when 86% of all homeowners who refinanced pulled cash out of their house – nearly $320 billion.
In the peak bubble years of 2004-2006, a total of 28 million mortgages were refinanced.
More than 20 million of them were first liens. As I indicated, Freddie Mac figures show that an increasing percentage of these were cash-out refis. The amount of cash pulled out by refinancing owners soared from less than $30 billion in the first quarter of 2004, to roughly $84 billion in the third quarter of 2006.
These were not homeowners who had built up substantial equity over many years. Freddie Mac's cash-out refinance report shows that by 2004, the average age of the first liens that were refinanced was only two years. Thus the vast majority of refinancing borrowers had bought their property in 2001 or 2002. Soaring home prices had made this possible. Yet because they had already paid a much higher price for their home than those who bought in the 1990s, their property was very vulnerable to going underwater once prices began to decline in late 2006.
Cash-out refinancing continued throughout 2007 even though the prices of homes in nearly all major metros had started to decline. According to Freddie Mac figures, another $240 billion was cashed out in 2007. Although it slowed considerably in 2008 when home prices were sliding everywhere, another $95 billion was cashed out.
What does all this mean? Forget the false idea that outstanding mortgages today cover a wide range of dates spanning several decades. The 20 million first liens that were refinanced between 2004 and 2006 represented more than one-third of all the first liens in existence then. Then add to this the $4.2 trillion in mortgages originated in these three bubble years. More than half of all the first liens outstanding by the end of 2007 had been originated during the bubble years of 2004-2007. That was the setting for disaster.
California – ground zero for the refinancing madness
Nowhere was the cash-out refinance craze more destructive than in California. There were five refinanced mortgages for every one purchase mortgage during the bubble years. The epicenter was Los Angeles.
In Los Angeles County, there were more than 155,000 refinance jumbo mortgages originated for homeowners just in 2005 and 2006. With an average size of $600,000 they totaled an incredible $93.2 billion. Freddie Mac's cash-out refinancing report reveals that 80% of all refinancing in 2005 were cash-out refis in LA and 92% in 2006.
An important study on the refinancing lunacy in California was written by Steven Laufer and published by the Federal Reserve Board in 2013. For his study, Laufer had access to mortgage data on every property in Los Angeles County. To make it manageable, he focused on 100,000 owner-occupied properties purchased between 2002 and 2004 and not through a foreclosure sale. From this, he culled a representative sample of 20,000.
Half of the 20,000 buyers in his sample had taken out a second mortgage at the time of the purchase. This meant that they had either made a very small down payment or had put down nothing at all. Between the time of purchase and the end of 2009 when the study ended, the typical household in this sample had taken out an average of 2.5 new mortgages. Forty-five percent of them were cash-out refis and another 10% were HELOCs. Many of them had refinanced more than once.
The author points out that by the end of the study period, 10% of the sample had defaulted on their mortgage. This default figure seemed low to me until I realized that he excluded serious delinquencies which had not resulted in a formal notice of default. This was a crucial exclusion because even by late 2009, there were a large number of delinquent borrowers whose property was not placed into formal default.
For all homeowners in the study who defaulted, Laufer found that over 40% of their outstanding debt was due to equity extraction after the home purchase. Because of the huge rise in home prices after they purchased the home, he calculated that for more than 90% of the defaulting borrowers their original mortgage balance would have been less than the value of the home at the time of the default. Had they not done one or more cash-out refis, they would have had little need to default. In fact, the main purpose of the entire study was to show that equity extraction through cash out refinancing was the most important factor which resulted in default.
This conclusion of Laufer's is essential to keep in mind when thinking about the situation today. He pointed out that 27% of the sample had been able to sell their property before the end of 2009 without going into default. Almost certainly, they were the wise owners who had not extracted the maximum equity with one or more cash-out refis. They sold their home to a buyer who paid a much higher price than they had. These new owners were in a much weaker position as home prices began to crater in Los Angeles and throughout California.
To give you a sense of the scope of cash-out refinancing in southern California, here is one example from an August 2009 article in The New York Times. In 1997, a couple had purchased a nice, four-bedroom house in Moreno Valley in the Inland Empire to the east of Los Angeles. The price was a mere $123,000. In 2003, they refinanced for $129,000. Like countless other Californians, when home prices began to soar they tapped their growing equity several more times. They refinanced in 2004 for $230,000 and once more the following year for $323,000. Still not satisfied, they refinanced a fourth time in 2006 for $374,000 and one last time in 2007 for $415,000. A year later, with the home's value collapsing, the couple was forced into foreclosure.
How the housing collapse was interrupted in southern California
If cash-out refinancing was so extensive and so destructive in Los Angeles County, why was the housing market there able to turn around?
When prices first leveled out and then started their plunge toward the end of 2006, over-leveraged homeowners began to default in droves. By 2009, the county saw 175,000 foreclosure filings (NOD), an increase of 37% over the previous year. Lenders foreclosed on tens of thousands of seriously delinquent borrowers.
However, as the collapse worsened, servicing banks sharply cut back on the number of foreclosed properties they put on the active resale market. For example, in July 2010, there were 29,695 repossessed homes (REOs) in Los Angeles County, but a mere 1,214 actually for sale. Of those up for sale, only five had outstanding mortgages over $600,000. The banks had decided that it was suicidal to place the extensive number of repossessed properties with mortgages over $500,000 on the market. So they held them and hoped that this would stem the bleeding.
Lenders in Orange County took the same approach. In July 2010, there were 6,236 repossessed REOs in the county, but only 226 had been placed on the market. Similarly, San Diego County had 4,270 repossessed homes but only 193 were for sale.
Once the banks saw that this desperate tactic was working, they tightened the spigot even further. With so few foreclosed properties on the market, the total number of homes for sale in California began a major decline in 2012 and prices finally leveled off.
Equity extraction in the New York City metro
Cash-out refinancing during the bubble years was not confined to California. It was concentrated in roughly 25 of the largest metros around the country. Take a look at this chart showing what took place in the nation's largest metro with roughly 20 million residents – New York City.

While equity extraction was substantial from 2000-2004, it accelerated in the peak years of 2005-2007. When prices began to fall, refinancing collapsed. As early as 2008, refinancing had plunged by 70% in New York City according to the Furman Center at NYU. As in Los Angeles, it was the enormity of homeowner equity extraction during the bubble years that led to increased mortgage delinquencies in the NYC metro.
The rise in mortgage delinquency occurred gradually in New York City. The problem was most severe in the borough of Queens. The percentage of homes more than 60 days delinquent in Queens climbed from only 3.5% at the end of 2007 to 11.2% in the first quarter of 2010 and to 13% by February 2011. For the city as a whole, the delinquency rate had also soared to 11% in early 2011. There were more than 700,000 first liens in the city at this time.
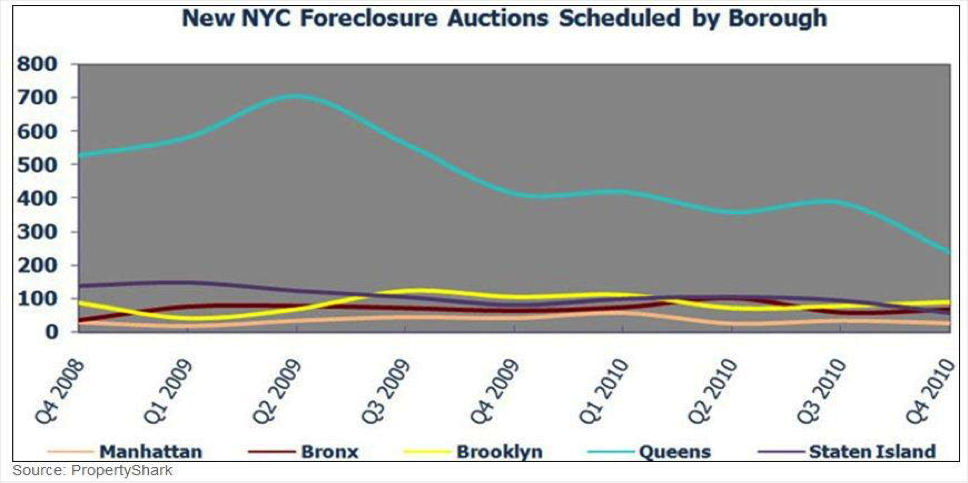
The servicing banks in New York City chose a more radical solution than in Los Angeles County. Rather than simply keeping foreclosed properties off the market, they refused to foreclose on the tens of thousands of delinquent homes. This graph illustrates the results of these radical actions.
Since the end of 2008, foreclosure auctions proceeded slowly in New York City. By July 2011, a mere 64 sheriff foreclosure sales were scheduled in Queens. By way of comparison, let's take Clark County where Las Vegas is situated. There were roughly the same number of first liens in Queens and Clark County. Yet in July 2011, there were nearly 3,600 sheriff sales scheduled in Clark County. As for repossessed properties on the market, Queens had 236 while Clark County had 17,187. The lack of foreclosed properties for sale in New York City was the main reason why home prices there declined much less than in Las Vegas.
Here is how to camouflage the mortgage delinquency problem
For more than six years, I have written extensively about soaring mortgage delinquencies in New York City. Let me explain how this has been hidden from the public.
In 2009, the New York State legislature passed a statute requiring that all mortgage servicers send out a pre-foreclosure notice to all delinquent owner-occupants in the state. The notice warned them that they were in danger of foreclosure and told them how they could get help. Servicers were required to regularly send statistics back to the state's Department of Financial Services for all notices sent out. The department published two reports in 2010 with a compilation of these numbers. That was the last time these statistics were officially reported.
I was able to obtain these unpublished figures from the person in charge of compiling the pre-foreclosure notice filings at the department. For six years, he has sent me quarterly updates of these statistics and I have published several articles using them.
The latest update shows cumulative figures through the fourth quarter of 2016. It covers only the five counties of New York City as well as Nassau and Suffolk Counties on Long Island. Here is a brief summary of what this table reveals.
Since February 2010, mortgage servicers have sent out a cumulative total of 1,003,343 pre-foreclosure notices to delinquent owner-occupants in New York City and Long Island. This does not include delinquent investor-owners because that was not required under the 2009 law. Approximately 85% of these notices were for delinquent first liens and the remainder were for second liens.
Roughly 40% of these notices were second or third notices sent to the same property. These are not duplicate notices. The servicers have been sending repeat notices to owners who have not taken action to cure their delinquency for more than a year.
This is confirmed by related figures published monthly in the Long Island Real Estate Report. For the last year, nearly half of the formal notices of default filed in Suffolk County are repeat notices. Why? In New York State, a default notice is only good for three years after which it expires. Lenders have had to file a new default notice for borrowers who have been delinquent for more than three years.
Although 288,000 pre-foreclosure notices have been sent to borrowers in Suffolk County, less than 1,000 default notices have been filed each month since late 2009. Why? Mortgage servicers have been compelled by statute to send out pre-foreclosure notices to all delinquent owner occupants. However, it is up to the discretion of the mortgage servicer whether or not they file a formal default notice on the delinquent property.
Some of you may reasonably object that these pre-foreclosure notice numbers don't reveal very much because many of these delinquencies may have been brought current by the borrower or may have been foreclosed by the servicing bank.
We do have reliable foreclosure figures from the well-respected Furman Center at New York University. Their 2015 State of New York City's Housing and Neighborhoods Report showed that an average of only 300 properties were foreclosed annually from 2011 to 2014. This is a city where 516,000 pre-foreclosure notices have been sent since early 2010. The Furman Center report also showed that an annual average of only 12,800 formal default notices were filed on delinquent NYC properties between 2011 and 2015.
Thus anyone looking only at the very low foreclosure or default figures for NYC could easily conclude that the delinquency problem is a thing of the past. Nothing could be further from the truth.
Collapse in the greater Chicago metro
Investors and speculators poured into the Chicago area housing market between 2003 and 2006 as prices climbed sharply. Home prices actually peaked at the end of 2005. Then speculators began dumping their properties onto the market. By March 2006, there were a record 115,000 properties for sale. That was the end of the boom.
As with Los Angeles County and New York City, cash-out refinancing was rampant in Greater Chicago. Freddie Mac figures show that 69% of all refinanced mortgages were cash-out refis in 2005, 82% in 2006, and 71% in 2007.
Mortgage defaults rose rapidly throughout 2008 and 2009 as prices tanked. The vast majority of defaults were on those mortgages originated in the peak bubble years of 2005-2007. Sales plummeted and home prices along with them. In 2010, 80,000 first liens were placed into default in the six-county Chicago region and roughly 30,000 of them were foreclosed. The servicers were also not putting into default many properties which were delinquent more than 90 days.
The housing market in Cook County (where Chicago is situated) was still crumbling in early 2011. In January 2011, my contact at CoreLogic informed me that 11.7% of all first liens in Cook County were seriously delinquent. Half of them had not been placed into default. In February, 51% of all Greater Chicago home sales were either repossessed properties or short sales.
The mortgage servicers decided to sharply cut back on the number of homes that they foreclosed at auction. As with Los Angeles and New York, servicers also severely restricted the number of foreclosed homes they put on the market. In July 2011, there were only 4,947 repossessed properties for sale in Cook County with a population of 5.2 million.
In June 2013, I spoke with the Woodstock Institute whose research is highly regarded. They explained that 338,661 foreclosure notices had been filed in the Greater Chicago region since 2008, but only 136,800 had actually gone to auction and been repossessed. Therefore, more than 200,000 homeowners remained in default without being foreclosed. Of course, this did not include the vast number of seriously delinquent deadbeats who had not even been placed into default.
Is there a pattern for these three large metros?
A clear pattern unfolded in the nation's three largest cities. As a result of the housing bust, serious delinquencies soared. The mortgage lenders decided that something had to be done to help the housing market. They drastically cut back on foreclosing and sharply reduced the number of REOs on the market. Like a tourniquet, this did stop the bleeding and home prices leveled off. Because this action seemed to work so well, the servicers have continued this strategy right up to the present.
Because of these actions by servicers in these three large metros, and throughout the country, nearly everyone has come to believe that the mortgage delinquency problem is over. This is not the case.
How bad is the mortgage delinquency problem for non-agency securitized loans?
Black Box Logic had the most comprehensive and most accurate database for the non-agency securitized loan universe. A year ago, their entire database and analytical software was sold to Moody's. To the best of my knowledge, Moody's has not yet made use of it.
Fortunately, we can still use Black Box Logic's data. It showed that the total amount of outstanding non-agency securitized mortgage loans peaked in November 2007 at $2.437 trillion. This included 10.6 million first liens. Going forward, the outstanding balance has declined each month and totaled roughly $701 billion in June 2015 with 3.79 million loans remaining outstanding.
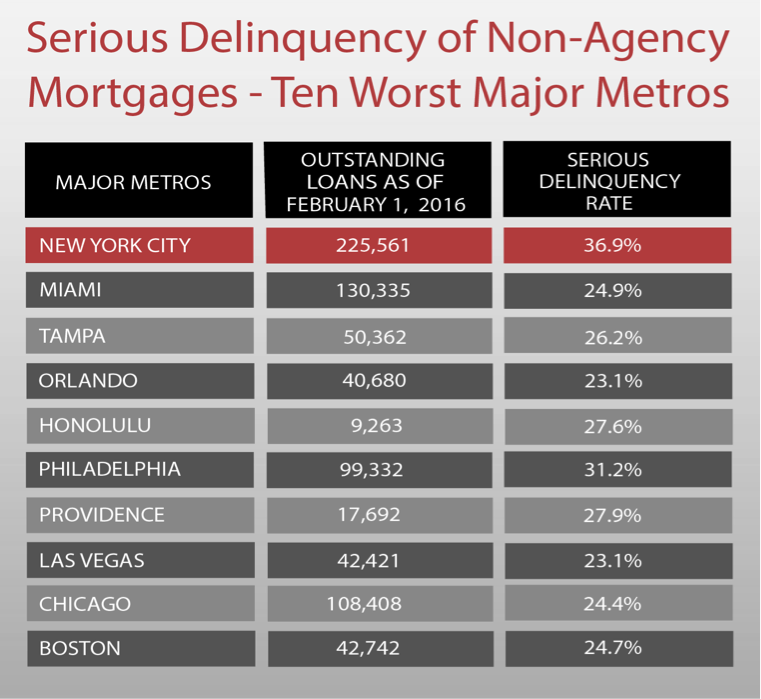
How high is the delinquency rate? Here is a table for the ten worst major metros:
Source: Black Box Logic
California metros do not appear on the list because the servicers have modified more than 40% of all California non-agency mortgages. That is a much higher percentage than any other state.
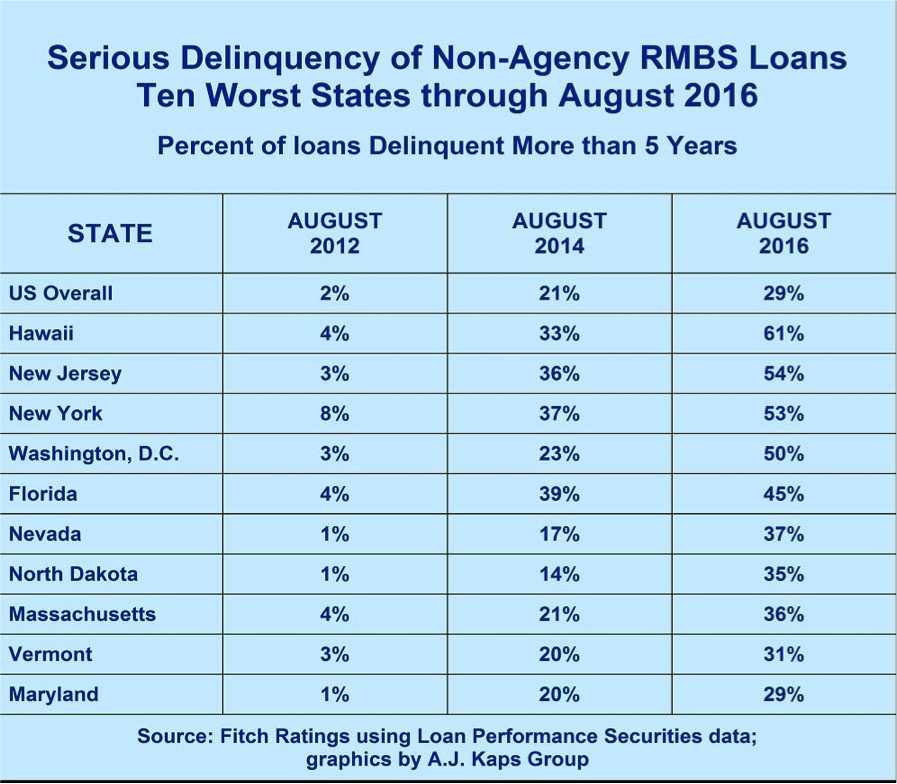
Take a look at this next table showing how long the borrowers in the worst states have been delinquent.
Nationwide, in August 2012 a mere 2% of these bubble-era loans had been delinquent for more than five years. Two years later, that percentage had soared to 21%. Hordes of underwater borrowers had simply stopped paying their mortgage. Homeowners found out that the servicers were not foreclosing and realized that they had little to lose by defaulting.
By August 2016, the nationwide percentage of borrowers who had not paid their mortgage for five years or more has climbed to 29%. In three states and Washington DC, it is more than half. Most of these delinquent homeowners are very likely still living in these houses. If you know that the mortgage servicers are not foreclosing, why not wait until they take action before moving out?
The complete failure of mortgage modifications
Disregard whatever you have read about declining mortgage delinquency rates. Those statistics put out by the Mortgage Bankers Association are useless with regard to the bubble-era mortgages.
The real picture lies in the mortgage modifications. The best source for this data is HOPE NOW – an alliance between counselors, mortgage companies, investors, regulators and other mortgage market participants. Their report for the third quarter of 2016 showed a cumulative total of 25.8 million “solutions.” This includes all mortgage modifications and a host of other “workout plans.” These are all programs designed to ease the burden of a delinquent borrower's mortgage. The stated goal is to prevent foreclosure and keep the homeowner in the house.
Borrowers who have either successfully completed a trial modification or have entered one of these workout plans are considered to be “current” on their mortgage. It does not mean they have paid all the interest arrears that have accumulated. This number of formerly delinquent borrowers who are now considered current is the only reason why the delinquency figures you read in the media have been declining for several years.
The most important issue for lenders, investors and homeowners is the likelihood that a borrower with a modified mortgage will re-default. Several studies have revealed that the earliest modifications of 2007-2009 had recidivism rates of 60 to 80%. Services tightened their standards and later modifications had much lower re-default rates of roughly 20 to 40%.
Figures from these reports show that the re-default rate for any particular modification year after 2009 rises the longer these mortgages remains modified. For example, a 2014 Federal Reserve study reported that only 38% of loans modified in 2010 were still current at the end of 2013.
Mortgages that have been through any type of workout plan have a high likelihood of re-defaulting. The April 2015 Black Knight Financial Services Mortgage Monitor covered a loan universe larger than non-agency mortgages. It reported that in March 2015, 70% of all seriously delinquent loans that had been modified in some way were already in their second or third modification. Worse yet, 43% of all seriously delinquent loans had failed one or more trial modification, permanent modification or other workout plan. That percentage had risen from only 35% three years earlier.
Conclusion
These re-default statistics clearly indicate that loan modifications have done nothing to solve the serious delinquency problem. As early as August 2012, Standard & Poor’s (S&P) stated that it assumed that 100% of all non-agency securitized loans which were delinquent by more than 90 days would eventually default. It has never retracted that assumption.
By themselves, these re-default statistics are alarming. When you add in S&P's gloomy assumption, the mortgage servicers' strategy is doomed to fail.
The number of very long-term delinquent borrowers with bubble-era mortgages has grown steadily. In the NYC metro, the delinquency figures continue to grow. When these seriously delinquent loans are actually liquidated, the loss is often 100% where the owner of the loan gets zero.
The longer a loan remains delinquent, the higher the arrears become. If a loan is modified, the arrears are usually tacked on to the loan principal (known as capitalization). I have seen actual loans with arrears of $300,000 or more. Thus at liquidation, the total amount owed usually far exceeds the value of the property, which is often vacant and badly deteriorated.
Smart lenders will soon begin to see that delaying foreclosures only makes their situation worse. They will realize that it is foolish to count on a bailout and they will start to liquidate these seriously delinquent loans before they are totally ruined. Others will follow and then the momentum down the hill will prove unstoppable.
Roughly $650 billion dollars of bubble-era loans are in jeopardy of eventual liquidation. It doesn't matter when this happens. Whoever owns these mortgages at the time of liquidation will suffer enormous losses on their investment. Lenders and investors need to take this as a warning.
Keith Jurow is a leading real estate analyst and the author of Minyanville’s Housing Market Report. Many of his other in-depth articles can be found at www.keithjurow.com.
Read more articles by Keith Jurow