Advisor Perspectives welcomes guest contributions. The views presented here do not necessarily represent those of Advisor Perspectives.
Stocks perform poorly when inflation is on the rise. The empirical data is supported by theory. Rising inflation means that interest rates are increasing and the discounted value of future cash flows is driven down, lowering equity prices. Let’s see if we can use the inflation rate to improve equity performance.
The inflation rate (INF) is the 12-month rate of change of the consumer price index (CPI). The CPI is provided by the Bureau of Labor Statistics (BLS) usually during the third week after the month to which it refers. Using the inflation rate, I developed a market timer according to two simple rules:
Sell rule for stocks:
INF > 6-mo SMA(INF) + 0.75%
Sell when the inflation rate exceeds its six-month moving average plus 0.75%.
Buy rule for stocks:
INF < 6-mo SMA(INF) - 0.20%
Buy when the inflation rate becomes less than its six-month moving average minus 0.20%.
The six-month SMA of the inflation rate establishes the trend of the inflation rate, and the two other parameters (+0.75% and -0.20%) were found by optimizing the model for the best return.
Performance
I calculated a hypothetical fund (“SPY*”) to reflect the performance of the S&P 500 with dividends reinvested by splicing the data from three sources: the SPDR S&P 500 ETF (SPY) from 1993 to 2016, the Vanguard 500 Index Fund (VFINX) from 1980 to 1993 and before that from 1953 to 1980 daily data of the S&P 500 with monthly dividends taken from the Shiller CAPE data.
I simulated a hypothetical money market fund (“SHV*”) with the Fed funds rate from 1953 to 2007 and thereafter spliced the iShares Short Treasury Bond ETF (SHV) to it.
All trading is assumed to occur on the first trading day of the week after the 20th day of the month when the CPI is known for the preceding month. A backtest of this model starting in 1953 provided the first buy signal for stocks on August 24, 1953.
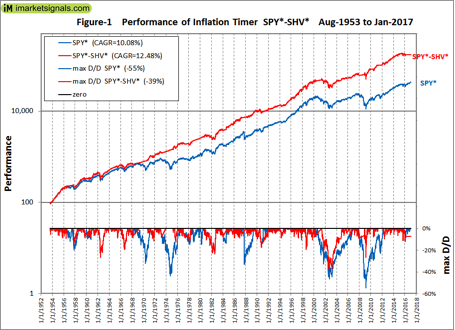
From 8/24/1953 to 1/30/2017 the model, switching between SPY* and SHV*, showed an annualized return of 12.48% with a maximum drawdown of -39% in 2002. Buy-and-hold SPY* gave an annualized return of 10.08% with a maximum drawdown of -55% in 2009 (Figure 1).
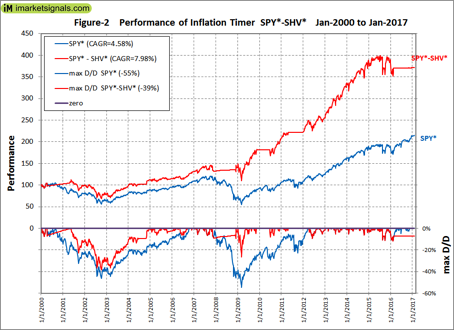
From 1/3/2000 to 1/30/2017 the model showed an annualized return of 7.98% with a maximum drawdown of -39% in 2002. Buy-and-hold SPY* gave an annualized return of 4.58% with a maximum drawdown of -55% in 2009 (Figure 2).
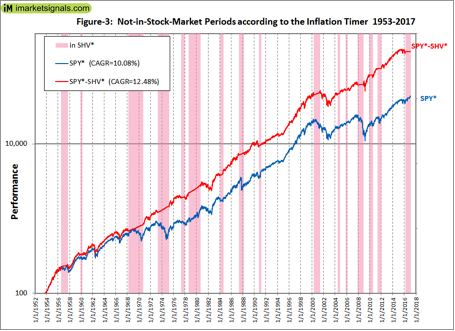
There were 16 periods from 1953 to 2016 when the inflation rate signaled to be in or out of the stock market. They are listed in the Appendix and are also shown by the vertical bars in Figure 3. This inflation timer signaled to be out of the stock market during the 1987 market collapse, but it also provided a sell signal for SPY* on 2/22/2016, preventing the model from gaining another 19% to 1/30/2017.

Conclusion
Higher returns could have been achieved by using a longer term bond fund instead of a money-market fund. However, I wanted to show the most conservative performance from this model, which over the period 1953 to 2017 provided 3.95-times the total return of what a constant investment in the stock market would have produced.
The model is simple to construct, but can also be followed live at ImarketSignals.com. Heeding the monthly signals from the inflation timer should provide insurance against major stock market declines and improve investment performance over longer time.
Georg Vrba is a professional engineer who has been a consulting engineer for many years. In his opinion, mathematical models provide better guidance to market direction than financial "experts." He has developed financial models for the stock market, the bond market, yield curve, gold, silver and recession prediction, which are updated weekly or monthly at http://imarketsignals.com/. Georg can be reached at [email protected].
Appendix
|
buy stocks
|
08/24/1953
|
|
buy bonds
|
07/23/1956
|
|
buy stocks
|
08/26/1957
|
|
buy bonds
|
11/23/1959
|
|
buy stocks
|
02/23/1960
|
|
buy bonds
|
02/26/1968
|
|
buy stocks
|
09/21/1970
|
|
buy bonds
|
04/23/1973
|
|
buy stocks
|
03/24/1975
|
|
buy bonds
|
04/25/1977
|
|
buy stocks
|
11/21/1977
|
|
buy bonds
|
08/21/1978
|
|
buy stocks
|
08/25/1980
|
|
buy bonds
|
01/23/1984
|
|
buy stocks
|
07/23/1984
|
|
buy bonds
|
04/20/1987
|
|
buy stocks
|
02/22/1988
|
|
buy bonds
|
10/22/1990
|
|
buy stocks
|
02/25/1991
|
|
buy bonds
|
04/24/2000
|
|
buy stocks
|
04/23/2001
|
|
buy bonds
|
06/21/2004
|
|
buy stocks
|
10/25/2004
|
|
buy bonds
|
10/24/2005
|
|
buy stocks
|
01/23/2006
|
|
buy bonds
|
11/26/2007
|
|
buy stocks
|
11/24/2008
|
|
buy bonds
|
11/23/2009
|
|
buy stocks
|
06/21/2010
|
|
buy bonds
|
04/25/2011
|
|
buy stocks
|
12/27/2011
|
|
buy bonds
|
02/22/2016
|
Read more articles by Georg Vrba