The Short-Term Nature of Robo Portfolios
Membership required
Membership is now required to use this feature. To learn more:
View Membership Benefits |
| Stephen J. Huxley |
 |
| John Y. Kim |
Advisor Perspectives welcomes guest contributions. The views presented here do not necessarily represent those of Advisor Perspectives.
Robo advisors have become what textbooks refer to as “disruptive” advancement: the traditional way of doing business in an industry changes dramatically, often due to the introduction of new technology. While technology has had an impact on the financial services industry, it is the quality of the robo advisors’ investment advice that will determine whether they become a lasting paradigm.
One of the many considerations involved in investment strategies is the appropriate time horizon. The asset allocation of robo advisors suggests they are more consistent with equity portfolios structured for short horizons. When evaluated in the context of time segmentation, the equity portfolios recommended by robo advisors for “moderate” investors were most strongly correlated to portfolios designed for one to three years. From a time segmentation perspective, short term does not imply that the portfolio is traded frequently, but rather that it is comprised of equity asset classes that tend to perform better in the short term at the expense of better long-term performance. Most financial planners emphasize that lifetime planning, by definition, should focus on the long term.
Fairly evaluating the investment performance of robo advisors is challenging. It is a dubious practice to judge any investment opportunity that has yet to produce a meaningful track record. Most of the robo portfolios are so new that it is difficult to make comparisons over a sufficiently long period.
However, to their credit, robo providers publish the allocations and funds they use in their portfolios. The allocations change but not precipitously. They are a little different in 2016 compared to 2015 but by less than a few percentage points for any one asset class. They will likely be a little different again in 2017 and in the future, but the changes are minor, at least so far, suggesting they intend to follow a strategic rather than a tactical asset allocation approach.
The open publication of their portfolios reveals the asset classes and allocations they use. Consistency in their allocations and a track record of 30 years or more for these asset classes permits estimates of how well their portfolios would have done for much longer spans of time than would otherwise be possible.
We compared several robo advisors’ equity portfolios to portfolios built to minimize worst-case scenario returns for time horizons from one to 40 years. Given that the average client of a robo advisor is often cited as under the age of 40 and assuming their only objective is saving for retirement, these younger investors should be investing for the long run. Unless robo risk tolerance questionnaires are sufficiently accurate to assess the true aspirations and needs of these younger clients, there is the risk of a mismatch between a robo advisors’ recommendations and the clients’ actual financial planning horizon. By attempting to lower near-term volatility, robo advisor portfolios sacrifice both long-term expected and downside performance for time horizons typically relevant to these clients.
Our definition of risk is not the traditional mean-variance focused volatility (typically quarterly or annual standard deviation). From a financial planning perspective, the risk of shortfall is far more relevant. We utilize the minimax principle and minimize the worst case downside performance time horizons driven by the timing of spending needs as our primary risk metric. For the average robo advisor client, the time horizon on their equity investments is well beyond 10 years, whereas the recommendations of robo advisors are more closely correlated with a one- to three-year horizon.
Background
The purpose of this paper is to investigate the asset allocation recommendations of robo advisors in the context of financial planning where investors typically require long time horizons on their equity investments. We briefly examine the performance over the past 31 years (1985-2015) of the recommended equity allocations for a “moderate” investor using a sample of four robos: Betterment, Motif, Schwab and Wealthfront. Performance was tabulated using www.portfoliovisualizer.com, a website that makes such comparisons relatively easy.
The evidence suggests that the portfolios they recommend for “moderate” investors are neither significantly better nor worse than the S&P 500 Index. However, there is a common theme that all the robos share in terms of performance – their short-term nature. In terms of allocations among asset classes, their portfolios correlate most strongly with equity portfolios designed for short-term, one- to three-year holding periods rather than portfolios designed for longer time horizons.
The average age of for robo clients has been reported to be late 30s to early 40s – a client base that generally requires long time horizons for the bulk of their savings that have been earmarked for retirement. Therefore, one would expect the portfolio to be designed for longer time horizons. If the robo risk tolerance questionnaires are sufficiently valid from a psychometric perspective to determine the true nature of each client’s risk tolerance, then there may not be a problem. But there is significant debate about the validity of risk tolerance questionnaire, and if the questionnaires fail to deliver, it brings into question the possibility of a mismatch between robo recommendations and the nature of their customer base.
The robos
To disguise their identities, the four robos examined are randomly ordered in the charts and tables below. That is, Betterment is not robo 1, Motif is not robo 2, etc.
For their moderate investor portfolios, one robo had an allocation close to 50/50 but three had 70% to 80% in equities (including minor allocations to commodities, REITS and, in one case, gold). Wealthfront provides the most extensive explanation of its investment methodology (Malkiel, 2016).
In this analysis, only allocations to equities (domestic, international and emerging) plus the alternatives listed above were considered (they were recalibrated to sum to 100%). There were several reasons for restricting the analysis to equities. First, the goal was to make an apples-to-apples comparison among the equity recommendations of the robos. Second, the equity portion of the portfolio traditionally serves as the long-term driver of growth for the overall portfolio. Third, most of the robos use index-based ETFs, so it is the allocations among these funds and the asset classes within them that will determine differences in equity performance (Brinson, Hood and Beebower, 1986, 1991). Finally, all but one of the robos had most of their allocations in equities, and the one who did not would likely be unable to keep up with the performance of the others in this sample over the long run.
The data
Data on annual returns and other portfolio computations came from Portfolio Visualizer, which tracks returns for all 36 asset classes shown in Exhibit 1 back to 1985 (with the lone exception of did-cap value, back to 1987), and as far back as 1972 for many.
Exhibit 1. Asset Classes Covered in Portfolio Visualizer
|
Domestic Stocks |
International Stocks |
Fixed Income |
Alternatives |
|
US Stock Market |
Intl Stock Market |
Total Bond |
REIT |
|
Large Cap Value |
Intl Value Stocks |
Global Bond |
Gold |
|
Large Cap Blend |
Intl Small Cap Stocks |
TIPS |
Precious Metals |
|
Large Cap Growth |
Intl Developed Markets |
Long Term Treasuries |
Commodities |
|
Mid Cap Value |
Emerging Markets |
10-year Treasuries |
|
|
Mid Cap Blend |
Intl Pacific Region |
Intermediate Term Treasuries |
|
|
Mid Cap Growth |
Intl Europe |
Short Term Treasuries |
|
|
Small Cap Value |
Cash / Money Market |
||
|
Small Cap Blend |
Corporate Bonds |
||
|
Small Cap Growth |
High Yield Bond |
||
|
Micro Cap |
Short Term Inv Grade |
||
|
Long Term Tax Exempt |
|||
|
Intermediate Term Tax Exempt |
|||
|
Short Term Tax Exempt |
The actual funds used by each robo can be found on their websites. Reports in The Wall Street Journal (Moyer, 2015 (1) and (2)) listed the allocations to specific funds in mid-2015. A check in mid-2016 revealed only minor changes from mid-2015.
The asset classes contained in each fund can be determined from Morningstar. For example, VTI (Vanguard Total Stock Market ETF) was used in three of the robo portfolios. Morningstar partitions funds and ETFs into their style box, listing the approximate percentage of each component equity classes (see Exhibit 2). On the day these allocations were tallied (5/31/2016), 24% of VTI is large value, 25% is large blend, etc. These allocations may drift slightly due to changes of a few percentage points as the markets shift, but most funds attempt to limit deviations from their target allocations
Exhibit 2. Asset Classes Comprising VTI Mutual Fund

Once the asset classes are known for each robo portfolio, Portfolio Visualizer’s evaluation tool will compute compound annual growth rate (CAGR), inflation-adjusted CAGR, standard deviation, best year, worst year, Sharpe ratio, Sortino ratio, U.S. market correlation, international market correlation and other characteristics. (See site for details on methodologies.) The calculations are based on data as far back as the shortest historical record. All data in this paper are based on 1985-2015.[1]
The free website allows the user to save up to 10 different portfolios for comparison purposes. It also includes a number of “lazy” portfolios, based on portfolios openly published by various commentators. The complete database and its sources are readily accessible. Clearly, a lot of work has gone into this site.
Data for the time-segmented portfolios came from our own research (Huxley, Burns, Fletcher, 2016). This research can be found as a white paper “Equity Yield Curves, Time Segmentation, and Portfolio Optimization” under the About/Research & News link on our website (www.assetdedication.com). (This paper is forthcoming in the November issue of the peer-reviewed Journal of Financial Planning.)
The time segmentation element of this research resulted from the use of mathematical programming to select allocations for holding periods of one, two, three years and so on, but not exceeding 40 years. The goal was to determine the optimal allocations among the equity classes that seek to minimize the worst case scenario over each of the 40 holding periods based on the “minimax” principle. The analysis led to equity models that achieved the goal at four time horizons: 1-3 years, 4-6 years, 7-15 years and 16-40 years (see Appendix for more details).
In practice, time segmentation portfolios are used in conjunction with a client’s financial plan, which designates the timing of cash flows that need to be generated by the client’s portfolio. Typically, for younger clients, their equity investments have many years before any portion would need to be converted to more predictable investments suitable for retirement income (namely bonds). Drawing down in bad markets is what puts pressure on a client’s financial plan. Aligning the time horizon where equities are converted to bonds with an equity portfolio that seeks to provide better downside performance for that horizon ought to lead to better synchronization between the plan and the investments. Thus, one would expect robo equity portfolios to have a longer horizon if they were linked in any way to how clients actually plan to spend their money.
The results: Static case
Exhibit 3 presents the results for the static case: $10,000 invested at the beginning of 1985 to the end of 2015 with no contributions or withdrawals other than the reinvestment of dividends for the robo, time-segmented and pure S&P 500 Index portfolios.
Exhibit 3. Characteristics of $10,000 Portfolio Invested, 1985-2015
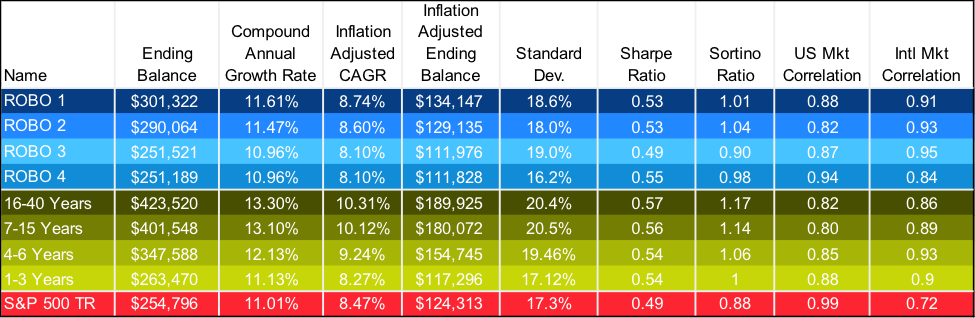
Exhibit 4 plots the cumulative results for each of the portfolios in Exhibit 3. Robos are in blue and perform in a relatively similar manner to each other. Two of the robos are a little better than the S&P 500, two are slightly worse. More importantly, Exhibit 4 suggests that the robo “moderate” investor portfolios are clustered about the one-three year portfolio, the shortest of the time segmented portfolio.
Exhibit 4. $10,000 Invested 1985-2015, Robos, Time Segmented Portfolios, S&P 500

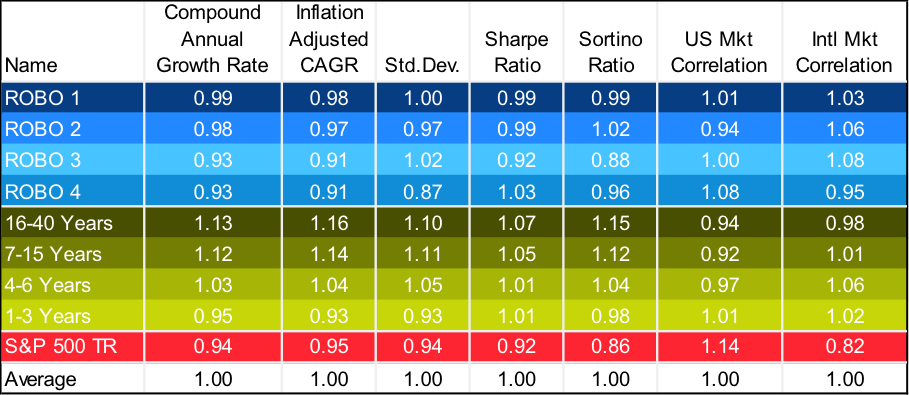
Exhibit 3 permits a correlation analysis to show the strength of each robo’s correlations to each of the time-segmented portfolios. To calculate the correlations, the columns in Exhibit 3 labeled “Ending Balance” and “Inflation-Adjusted Ending Balance” were excluded to avoid redundancy with the compounded annual growth rate (CAGR) and inflation adjusted CAGR figures. The raw values in Exhibit 3 were then standardized as index numbers where the average equals 100 in each column to avoid dimensionality problems. These standardized values are shown in Exhibit 5.
Exhibit 5. Standardized Portfolio Characteristics from Exhibit 3 as Index Values
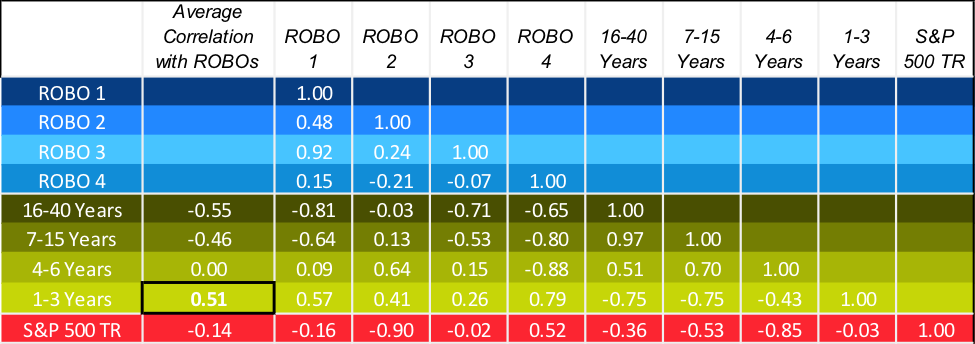
The plot in Exhibit 4 showing cumulative values over time suggests the strongest positive correlations will be with the one-three year portfolio. Exhibit 6 reveals this is, indeed, the case. The one-three year portfolio has the strongest average positive correlation (0.51) with the robo’s characteristics. The four-six year portfolio has an average correlation of zero. The longer term portfolios of the 7-15 Year and 16-40 Year, actually have negative average correlations. These correlations are commensurate with Exhibit 4; Robo equity portfolios for the moderate investor appear to be designed for short run rather than long-run performance.
Exhibit 6. Correlations Among All Portfolios of Characteristics in Exhibit 5
The results: Dynamic case (additions to portfolio)
To further highlight the consequences of the short-term nature of the robo portfolios, Exhibit 7 illustrates $1,000 being saved annually plus the prior year’s inflation. The first deposit is made at the end of 1985 and at the end of every year thereafter. The balance at the end of 2015 is shown for each portfolio and on the plots for the best ($244,283 for the 16-40 Year portfolio), worst ($169,437 for robo 3) and S&P 500 ($208,125) cases.
Exhibit 7 reveals that what was true for the static case is also true for the dynamic case: the robos are clustered around the one-three year and four-six year portfolios. This confirms that if a “moderate” investor by robo standards in the accumulation phase were saving and investing regularly, he or she would not have accumulated as much at the end of 31 years compared to investments made in portfolios designed for the long term.
Exhibit 7. Ending Balance of Saving $1,000 Plus Inflation at the End of Each Year, 1985-2015

Conclusion
Clearly, the robo advisors are depending on risk-tolerance questionnaires to derive the portfolio mix that suits their clients. This presumes that their questionnaires are accurate, reliable and valid from a psychometric standpoint. Unfortunately, the mapping of client’s responses to robo advisor portfolios appears to be very shortsighted with respect to the timing of when clients plan to spend their money. Time segmented portfolios with longer horizons, 7-15 years and 16-40 years, have been shown to have not only better prospects when markets are at their worst, but also better long-term expected return.
For robo advisors utilizing a mean-variance approach, the adequacy of questionnaires to capture all aspects of risks to a client’s financial plan is a debated topic. A large collection of papers can be found on the Finametrica website (2016) and other writers have also contributed to the continuing stream of literature debating the topic (MacKillop, 2016; Roszkowski, et al, 2005). The potential mismatch between a robo advisor’s portfolio recommendations and a client’s actual financial plan could lead to clients working longer and harder than necessary to sufficiently save for retirement.
Stephen J. Huxley, Ph.D.: Chief Investment Strategist and founding partner of Asset Dedication LLC, professor of business analytics and former Associate Dean at the University of San Francisco. Recipient of awards for teaching, research and service at USF and nationally. Published in academic journals and conferences. Co-authored Asset Dedication (McGraw-Hill, 2005) with Brent Burns.
John Kim: Associate Director of Operations, Asset Dedication, LLC. Previously, a loan officer at Ohana Pacific Bank for commercial and consumer loans, performing financial analysis for all trouble debt restructure (TDR) reporting. Earlier experience included Bank of the West in the Financial Performance Measurement Department. B.A., Economics, UC San Diego, 2009.
Appendix
The optimizing strategy was to select the allocations that minimized damage that the worst case scenario would cause for each of the 40 time periods examined based on the minimax principle. The minimax principle is rooted in the work of John von Neumann, whom many believe was the greatest mathematician of the 20th century (Halmos, 1980; MacRae, 1999). He was one of the founding fathers of the field of decision analysis and game theory. A contemporary of Albert Einstein at Princeton, he is credited with discovering the minimax principle – the strategy in decision theory that, when deciding among several alternative courses of action, some of which could result in a loss, it is optimal to make the best of a bad situation by choosing the action that will create the least amount of losses if the worst case scenario does, in fact, happen. Wald also contributed to this theory (Wald, 1944). Since it is poor market returns that will cause problems for a financial plan, the minimax solution in portfolio theory is quite congruent with the goal of most investors, especially those who are conservative. There is no guarantee a minimax portfolio will not lose money in any given year or that its expected return will be higher than portfolios based on other investment strategies. But its goal is to maximize the minimum gain that the portfolio will achieve for the selected horizon.
To build out the four different time segmentation portfolios used in this paper, we first developed 40 different allocations at horizons from 1 to 40 years. Then we used a technique known as “cluster analysis” to crystallize the allocations into four equity models. Cluster analysis is the clustering or grouping of a set of results in such a way that objects in the same group (called a cluster) are more similar (in some sense or another – the pattern of returns since 1928 in this case) to each other than to those in other groups (clusters). The resulting four equity allocation models spanned time segments of 1-3 years, 4-6 years, 7-15 years and 16-40 years.
References:
Brinson, Gary P., Hood, L. Randolph, and Beebower, Gilbert L., 1986. Determinants of Portfolio Performance, The Financial Analysts Journal, July/August 1986
Brinson, Gary P., Hood, L. Randolph, and Beebower, Gilbert L., 1991. Determinants of Portfolio Performance II: An Update, The Financial Analysts Journal, 47, 3 (1991)
Fein, Melanie L., 2015, Robo-Advisors: A Closer Look (June 30, 2015). Available at SSRN
Finametrica, 2016 (accessed 6/26/2016)
Halmos, Paul R., 1973, “The Legend of John Von Neumann,” The American Mathematical Monthly
Vol. 80, No. 4 (Apr., 1973) (accessed 6/16/2016)
Huxley, S.J., Burns, B., Fletcher, J. 2016, “Equity Yield Curves, Time Segmentation, and Portfolio Optimization,” submitted for publication (accessed 6/28/2016: www.assetdedication.com).
Investment News, 2016: (accessed 6/21/2016)
MacKillop, Scott, 2016 “Are Risk Tolerance Questionnaires a Silly Waste of Time?” Advisor Perspectives, June 7, 2016 (accessed 6/10/2016. Extensive discussion following its publication can be found on APViewpoint here)
MacRae, Norman, 1999: “John Von Neumann: The Scientific Genius Who Pioneered the Modern Computer, Game Theory, Nuclear Deterrence, and Much More,” American Mathematical Society, 1999 (accessed 4/12/2016)
Malkiel, Burton, 2016 “How to build and manage a diversified investment portfolio,” Wealthfront Investment Methodology White Paper (accessed 6/10/2016)
Moyer, Liz, 2015 (1) “Five Robo Advisers, Five Very Different Portfolios,” The Wall Street Journal, April 24, 2015 (accessed June 22, 2016)
Moyer, Liz, 2015(2) “Putting Robo Advisers to the Test,” The Wall Street Journal, April 24, 2015, (accessed June 22, 2016)
Roszkowski Michael J., Ph.D.; Davey, Geoff; and Grable, John E., Ph.D., CFP®, 2005 “Insights from Psychology and Psychometrics on Measuring Risk Tolerance,” Journal of Financial Planning
Wald, Abraham, 1945. “Statistical decision functions which minimize the maximum risk,” The Annals of Mathematics, 46(2): 265-280 (accessed 4/12/2016)
[1] Midcap Value extrapolated from 1987-2015 returns. S&P 500 returns, which start at 1988, were derived from other sources.
Membership required
Membership is now required to use this feature. To learn more:
View Membership BenefitsSponsored Content
Upcoming Virtual Events View All


