A year and a half ago, I wrote an in-depth article showing why the so-called recovery in the commercial office market was only an illusion. Wall Street and the pundits continued to proclaim the strengthening of the office market. For example, the chief economist of the highly respected data firm, Reis, declared last October that in spite of stubbornly high vacancy rates, the recovery in the office market was “gathering pace.”
With weakness becoming more and more obvious in several of the hottest office markets, here’s why large office-market REITs are substantially overpriced.
Investor complacency continued unabated last year
As commercial real estate sales soared in 2015, so did the optimism of investors. In its mid-year Investor Outlook, Preqin reported that 57% of large investors surveyed had a positive perception of the real estate asset class, up from only 37% six months earlier. Only 6% of them had a negative view. Nearly 80% of them intended to commit the same or more capital to real estate over the next 12 months.
This chart from Real Capital Analytics shows how buying has soared.

Source: Real Capital Analytics
By the end of 2015, total commercial real estate sales had almost returned to the levels of the peak bubble year – 2007. The sales growth of 2013-2015 was almost identical to that of 2005-2007. Sales of office buildings in the U.S. climbed to $146 billion in 2015, 40% higher than in 2013. In my 2015 article, I pointed out that nearly half of the total dollar volume of office sales in 2014 occurred in just five major markets: Manhattan, Boston, San Francisco, Los Angeles and Washington, D.C. The same domination by these markets continued last year. If we add one more metro – Silicon Valley – these six accounted for more than 50% of all nationwide sales.
As in previous years, the Manhattan office market towered over all others with nearly 20% of all U.S. sales. Its price per square foot was hundreds of dollars greater than any other metro. Foreign investment as well as institutional money poured into Manhattan, especially in the high-tech area known as Midtown South. Prices soared well above the former peak levels of 2007. Chicago was a distant second with a mere 6% of total sales.
Is it possible that this time, things really are different?
What has happened in the hottest real estate markets?
Real estate busts nearly always begin in the hottest markets. Quite unexpectedly, not enough optimistic buyers bid on the huge supply of properties that are offered by sellers. Prices begin to flatten out as sales weaken. Sub-listing of space soars just as a lot of newly built office space hits the market. Empty space stays on the market longer as prospective tenants balk at the lofty rents still being asked.
The cooling of San Francisco and Silicon Valley
Other than Manhattan, the San Francisco Bay area has been the hottest commercial real estate market in the country. San Francisco real estate is inextricably tied to what is happening in Silicon Valley. For nearly five years, that has meant the five giants: Apple, Google (now Alphabet), Facebook, Netflix and LinkedIn.
Since 2010, these five companies have leased half of all new office developments either completed or under construction in Silicon Valley. According to Newmark, Cornish & Carey, there is 9.4 million square feet of office space under construction now.
Although layoffs have not yet soared in Silicon Valley, there are clear signs that something is afoot in San Francisco. The office market there has been booming for five years fed by IPOs, large investors and foreign money. Prices of properties have soared along with downtown rents.
A construction boom is obvious to anyone touring the city. New office buildings are pouring onto the market. At the same time, space absorption was down nearly 37% in the last four quarters from the year earlier period. This is a serious warning sign that the boom is over.
The biggest red flag is the soaring amount of sub-lease space hitting the market now. It is offered by firms who grabbed additional space at almost any price during the boom years in anticipation of hiring down the road. They have started to shed what is now clearly unneeded space. Available sublease office space has risen to levels not seen since 2010.
The slowdown has not yet shown up in official vacancy rates or asking rents. But for those who have been through this boom-bust cycle before, that will surely follow as available sub-leasing space continues to climb. Tenants unwilling to renew leases at current asking rents will look for cheaper deals.
The Houston market is tanking
Houston is an energy city. Crude oil had hit $120/barrel by late 2011 and remained above $100 for most of the next three years.
Its office market was one of the hottest in 2013 with more than 10% of the total inventory turning over. Average prices were up 21% from a year earlier. Net absorption of office space was the third highest in the nation behind only Manhattan and Dallas.
As in San Francisco and Silicon Valley, energy companies were warehousing office space they anticipated needing. In response, office construction soared. Then in 2014, oil prices began their collapse. All the expectation and planning for rising office demand disappeared.
By the first quarter of 2016, sublease space had climbed to more than 9 million square feet. That was more than double that of only a year and a half earlier.
The office market is collapsing in Houston. Leasing activity is plunging – down nearly 60% in the first quarter from the fourth quarter of 2014 and the lowest in a decade. This is just when 8 million square feet of new construction has come onto the market with another 3 million more on the way. Space availability in the Katy Freeway sub-market with its energy concentration has skyrocketed from 6.9% in 2013 to 31.2% in the first quarter of this year.
Danger signals in the Manhattan market
Like San Francisco, Silicon Valley and Houston, the Manhattan office market was red-hot in 2013. Sales volume was up by 40% from 2012 and average prices soared by 20%. Fourteen percent of all the office space absorption in the U.S. occurred in Manhattan. Average rents climbed by nearly 10% over the previous year.
The warning signs of a topping out are more subtle in Manhattan but are clearly present. Sales of all commercial real estate in the first two months of 2016 were down by 40% from a year earlier.
Leasing activity also slowed through the first five months of this year – down 13.5% according to real estate publisher The Real Deal. For several years, the hottest section of Manhattan has been the hi-tech area known as Midtown South. Data provider Savills Studley reported that available sublet space jumped more than 30% in the first quarter from a year earlier. They also reported that non-tech firms in that area are more reluctant to renew leases at current asking prices.
In the rest of Midtown, leasing activity has also slowed this year for non-tech firms. Large law firms in Midtown are looking feverishly to unload space.
What about rents in Manhattan? The Savills Studley report pointed out that asking rents are not a good indicator of leasing activity. They are a lagging indicator of market realities and don't reflect concessions that are creeping into lease deals. For example, tenant improvement allowances have been increasing. Overall, spreads have been widening between asking rents and what tenants are willing to pay.
Is the spigot closing on commercial real estate loans?
Borrowed money has always fueled real estate booms. Lenders provided sufficient money the last four years to push prices above the 2007 bubble peaks in nearly all the top 10 metro markets. Is it drying up now?
In the bubble era insanity of 2005-2007, it was the smaller commercial banks that shoveled out commercial real estate mortgages with disregard of prudent underwriting standards. Had the Financial Accounting Standards Board (FASB) not bailed them out in 2009 with the end of mark-to-market accounting, hundreds more would have failed.
Did these banks learn anything from this near disaster? Apparently not. By 2014, smaller banks were once again originating commercial mortgages in earnest. In the past 12 months, their commercial mortgage portfolios soared by more than 10% and underwriting standards have loosened considerably. As a group, nearly 40% of the total loan portfolios of these smaller commercial banks are in commercial mortgages. Some have as much as 60% or more.
Lending via commercial mortgage-backed securities (CMBS) roared back these past three years. Last year, it topped $100 billion and was expected to hit $125 billion in 2016. However, CMBS originations in the first quarter plunged by one-third compared to a year earlier. Figures for all of 2016 are unlikely to reach even $75 billion. Yields on BBB securities rose substantially. Lending standards have also tightened in the wake of last year's high-yield debt collapse.
This softening in the CMBS market has brought the issue of CMBS loans coming due to the forefront.
Paying the piper: CMBS loans coming due
Optimists repeatedly point out that the CMBS delinquency rate has been falling for several years. But the “extend and pretend” ploy has enabled mortgage servicers to do so-called “workouts” and avoid foreclosing on very troubled properties. However, the worst is yet to come. Take a good look at this chart showing the amount of CMBS balloon loans coming due.
Source: Goldman Sachs and Trepp
It is 2016 and 2017 when the bulk of CMBS loans will be coming due -- $267 billion. The vast majority of them are 10-year balloon mortgages originated during the wildest bubble years of 2006-2007.
To say that underwriting standards disappeared during these two years is an understatement. Here is what occurred.
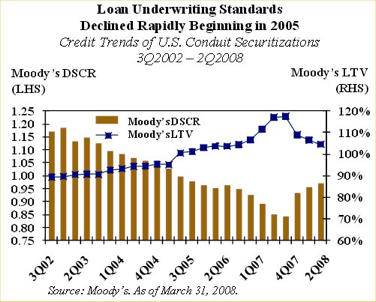
In 2004 before the market really heated up, the average loan-to-value ratio (LTV) on CMBS loans reported by the “big three” rating agencies was roughly 87%. This figure rose in each of the succeeding three bubble years.
By the end of 2006, most deals were being underwritten with LTVs of 100%. A year later, the average LTV had soared to roughly 110%. This means that lenders were writing loans that exceeded the appraised value of the property. That was total insanity and a recipe for disaster. Yet hardly anyone seemed to care.
Debt-service-coverage ratios (DSCR) plunged as completely unrealistic rental growth projections were permitted. The result was that enormous dollar amounts of loans were underwritten that would not have passed muster only a few years earlier.
This chart from Moody’s shows the decline in underwriting standards during these worst bubble years.
One last key factor – roughly 80% of the loans had interest-only terms with no amortization built in. So when you consider the massive balloon payments coming due in 2016-2017, keep in mind the terrible quality of the loans that are maturing.
Is now the time to sell?
A year ago, I wrote an article on knowing when to sell. That was a time of widespread optimism and euphoria. As a result, there was very little serious discussion of investment risks in real estate. This complacency led usually prudent investors to dismiss any serious consideration of selling overvalued investments while markets are still strong.
A clear sign that savvy investors sense that real estate has peaked appeared six months ago. Sam Zell is chairman of Equity Group Investments and founder of the largest apartment REIT – Equity Residential (EQR). He declared last December, “With pricing currently available in the commercial real estate market, it is very hard not to be a seller.”
Following his own advice, Zell sold roughly 23,000 apartments – one-fifth of his entire Equity Residential portfolio – a month later. Zell also knows about tops in office markets. He sold his office property REIT – Equity Office – for $39 billion in 2007 right before the market tanked.
Review of large office REITs
Since many of your clients own one or more equity REITs, it is useful to analyze a couple of the larger office-market REITs.
Boston Properties (BXP) is a good example of a REIT with properties concentrated in four of the hottest office markets – New York, San Francisco, Boston and Washington D.C.
From BXP's 10-Q report for the first quarter of 2016, we learn that net income was $1.18/share, up by 5% from the year earlier quarter. Net cash from operations was $349 million. Much of this was eaten up by construction in progress, building improvements and tenant improvements. What cash remained was insufficient to cover last year's quarterly dividend. Hence this year's dividend was slashed by more than 60%. In mid-June, the company announced that the dividend would be cut again to only $0.65.
For the past several years, Boston Properties has invested billions in speculative office construction. At the end of 2013, they had nine properties under construction with an estimated total cost of $2.5 billion. Construction on its 60-story Salesforce Tower in San Francisco began that same year. In the 10-Q report, they state that it is expected to cost a total of more than $1 billion when finally completed in 2019. By the first quarter of 2016, more than 3.8 million square feet of office properties were under construction.
In BXP's assessment of its four major markets, they admit that leasing activity has slowed considerably in New York and San Francisco and continues to be very slow in Washington D.C. They expect occupancy rates next year to be somewhere between 90% and 92%, down substantially from nearly 94% in 2013.
They currently have 3.5 million square feet of vacant space available for lease and another 1.6 million coming on the market through expiring leases. That is a huge amount to deal with as these markets soften.
Boston Properties has more than $10 billion in debt of which roughly $2.7 matures in 2016 and 2017. Should its four office markets continue to weaken, it will have a difficult time renegotiating these loans.
Notwithstanding these issues, BXP shares closed on September 9 at 135 with a P/E ratio of 35. Can such an elevated P/E ratio and share price be justified?
Let's see what happened during the bubble years. The share price soared to a peak of $122 in January 2007 before plunging for two years as the crash unfolded. It finally bottomed in March 2009 at $28.60. Nearly everyone who bought prior to late 2008 saw their investment crushed.
Could this happen again? Conditions in the hottest office markets resemble the bubble year of 2007. If you have clients who own this popular REIT, I urge you to advise them to unload the shares now.
SL Green Realty (SLG) is the granddaddy of office property owners in Manhattan. Founded in 1997 as a REIT, they own dozens of office properties located primarily in midtown Manhattan. They also own office properties in the surrounding suburbs of Westchester County, Brooklyn, Long Island, Connecticut and New Jersey.
The value of SLG shares went on a tear when the marked bottomed in early 2009. However, few investors know what happened after the real estate bubble peaked in early 2007. The shares hit an all-time high of $151.8 at the end of January 2007. Like the other equity REITs, it then proceeded to crumble. The share price bottomed in late February 2009 at $8. That is a decline of nearly 95%. Just about every investor who purchased before early 2009 was completely decimated.
Had anything precipitated the collapse of the shares? In August 2006, SLG had purchased a major rival – Reckson Associates Realty – for $4 billion in cash and stock. Was the purchase reckless? Not according to Bruce Moser, the then CEO of brokerage giant Cushman & Wakefield. An August 4, 2006 article in the New York Times quoted him as saying: “When a sophisticated investor like SL Green makes this kind of a commitment, it’s just a huge vote of confidence in the strength of the office marketplace.”
Any investors who acted on Moser's ill-timed assessment saw their portfolio pulverized by the office market collapse.
By early 2014, SLG shares sported a lofty P/E ratio of 120. The price finally peaked at 136 in March 2015. On September 9, 2016, its price was $111 and its P/E stood at 26.5.
Let's look at SLG's most recent 10-Q report for the first quarter of 2016. Its income from continuing operations was basically zero. It had net income attributable to common stockholders of $0.23/share only because of the sale of some real estate. Yet SLG managed to pay a quarterly dividend of $0.72, which was up from $.60 in the year earlier quarter. This was possible because of borrowings of $520 million in the quarter.
Like many equity REITs, SLG is heavily burdened with debt. Its outstanding mortgage debt stood at $7.1 billion. With cash and equivalents of only $316 million at the end of the first quarter, it will be hard-pressed to cover the $310 million in loan principal coming due in the remainder of 2016 or the $1.1 billion maturing next year.
How do investors justify paying more than $100 per share for a REIT with these numbers? Not easily! That is the euphoria I have been writing about for several years. If you have clients who own shares of SLG, my advice is to sell them now before the office market weakness becomes obvious to all.
Conclusion
By the time today's warning signs turn into a downturn or something worse, it may be too late for real estate investors. As I have vehemently asserted for several years, the time to sell equity REIT shares is before the crack up comes and the selling window shuts.
In real estate, there is a smart time to buy, a good time to hold and a prudent time to sell an investment. Savvy real estate investors have done well since 2009. Your clients should follow Sam Zell and sell while the window of opportunity is still open.
Keith Jurow is a real estate analyst and former author of Minyanville’s Housing Market Report. His new report – Capital Preservation Real Estate Report – launched in 2013.
Read more articles by Keith Jurow