Is it really impossible to find outperforming mutual funds in advance? It depends on where, and how, you look.
Asset flows to passively managed funds are surging. But, as often happens, advisors are embracing a trend just as debunking information is arriving in the marketplace. New research is showing that selecting above-average active funds may not be the impossible task that the academic research has suggested.
Dr. Michael Phillips, one of those spearheading this research, can be fairly accused of living in financial academia, the bastion of research whose studies have convinced many financial planners that it is impossible to reliably outperform passive benchmarks with active investment options. A former economist with the U.S. Department of Commerce, Phillips served as professor of finance at the University of Southern California before taking his current position as chair of the Center for Financial Planning and Investment at California State University at Northridge. He’s has co-authored (with Dr. James Chong, also of Cal St. Northridge) four recent academic articles in the Journal of Wealth Management, plus research reports in the Journal of Derivatives & Hedge Funds, the Journal of Interdisciplinary Economics, the Journal of Corporate Treasury Management and the Journal of Personal Finance.
Two years ago, Phillips was asked by the fi360 organization in Pittsburgh to evaluate the organization’s Fiduciary Scores. This screening tool uses Morningstar data to grade all mutual funds based on nine criteria that would be appropriate for a hypothetical prudent investor. The highest scores are reserved for funds whose portfolio management team has been in place for the past two years; whose portfolios are reliably consistent with the asset class they’re purported to represent; which exhibit high correlation with the performance of that asset class; which have low expense ratios relative to peers; and above-average risk-adjusted performance relative to peers over several time periods. Scores are aggregated, each fund or ETF is given a percentile ranking based on its placement among its peer group and then the results are color-coded. The funds with the highest 25% aggregate fiduciary rankings are assigned a dark green color, and the remaining quartiles are light green, yellow and red for the bottom quartile.
“In all, we looked at a million different observations,” says Phillips, “and tried to determine if the funds in the ‘green’ category would consistently provide better results than the other categories in several dimensions over one-, three- and five-year future time horizons. The fi360 people told us to beat on it as hard as we could wearing our academic hats.”
What Phillips concluded at the end of the project would be surprising to any researcher who believes in efficient markets. “After a lot of analysis, we found that their top grouping, the funds that were colored green, generally had higher returns and lower volatility,” Phillips reports. “If you put your 401(k) or long-term pension plan into the fi360 green or light-green investments, it wound up being an excellent screen. It started us thinking,” he adds, “that maybe there were other tools that could be used to help people find the best mutual funds to buy on a five-year horizon. Sure enough, we found something hidden in the data that nobody could have expected.”
Strong passive fund flows
In the court of public opinion, and particularly in large segments of the financial planning/investment advisor population, the debate between active and passive investing is largely settled. The Brinson, Hood, Beebower research concluded that all kinds of security selection (including attempts to find above-average fund managers) adds almost exactly as much value as market timing. Since around 1965, a variety of research papers by Eugene Fama, Michael Jensen, Christopher Philips, Francis Kinniry and Todd Schlanger – – and most recently, Rick Ferri of Portfolio Solutions and Alex Benke of Betterment (see here) – – have concluded that anywhere from 82% to 90% of actively-managed funds fail to outperform their index benchmarks, with the higher percentages associated with longer time periods. The fact that different funds outperform over different time periods has led to the logical conclusion that luck was more important than skill for at least some of those managers with outperforming track records.
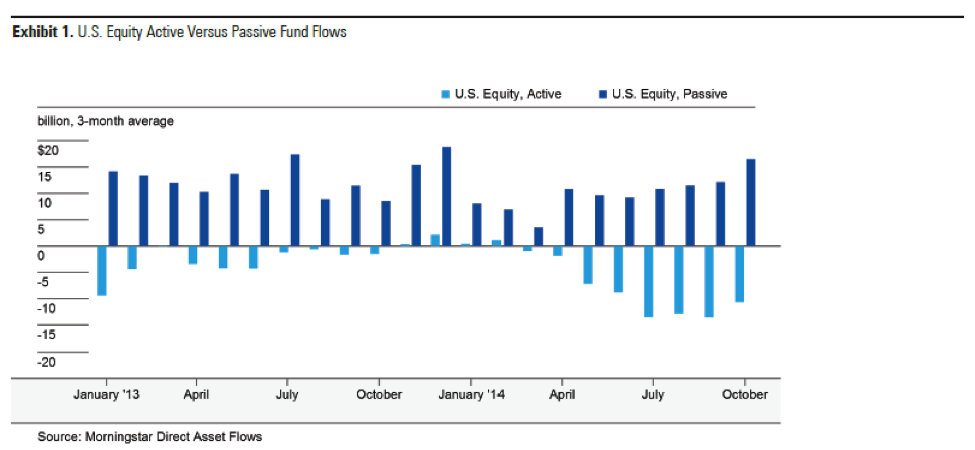
In the past three years, investors have taken this seemingly-settled academic conclusion to heart. Last year, when Morningstar researchers calculated asset flows into actively- and passively-managed stock and bond funds, they found significant outflows from active and significant inflows into passive. (See exhibit 1.)
The 2015 Investment Company Institute (ICI) Fund Factbook suggests that this is actually a very recent phenomenon. Net new cash flow to index funds climbed incrementally from $56 billion in 2009 to $59 billion in 2012 before exploding to $114 billion in 2013 and $148 billion last year. Add $800 billion in cumulative outflows from actively-managed stock funds since January 2007, and you find that index funds now make up 20.2% of total equity fund assets – – and that figure doesn’t count $2 trillion in ETF assets under management.
According to a recent PWC research report (Asset Management 2020), if present trends continue, assets in actively-managed mutual funds worldwide will increase by 30.5% between now and the year 2020, while passively-managed funds will experience a growth rate ten times higher, of just over 300%.
New research challenges whether those asset flows will be misdirected. It falls into two categories: identifying time periods and asset classes where active managers are easier to spot and/or add more value; and identifying better search criteria and better data than the relatively simple returns models used by academia.
Active management and market volatility
Some of the most interesting new research is coming from the funds themselves. Indeed, looking for better ways to evaluate (or spot) their own track record has become a new cottage industry in the mutual fund world.
Consider, for instance the Royce funds’ September 30, 2014 quarterly review, which falls into the first research category: identifying the best conditions for active management to flourish. The report cites yet another bit of scripture from the passive camp: the S&P Index Versus Active (SPIVA) scorecard, which has become a closely followed scorekeeper of the active vs. passive debate since it was first published in 2003. Using the S&P Dow Jones indices and the CRSP database, the scorecard found that the 12-month period ending June 30, 2014 was pretty normal: 59.8% of large-cap managers, 58.8% of mid-cap managers and 72.8% of small-cap managers underperformed their respective benchmarks.
But this snapshot was taken during a period of low volatility, when the aggregate pool of investors is largely in agreement on pricing and valuation. The Royce research team hypothesized, based on their own direct experience in the marketplace, that periods of high volatility, when buyers and sellers are having a harder time making up their minds, are the best times for active managers to find mispriced securities.
To see if this might be true, they looked at rolling 12-month standard deviations in the small-cap market from the inception of the Russell 2000 index on 12/31/1978 through September 30, 2014. Then the Royce analysts sorted the resulting 418 data points from highest to lowest, divided them into quintiles, and looked at the aggregate active management returns during each quintile time period.
The result? When the standard deviation was the highest – averaging a scary 29.29 – active managers beat the index by an average of 2.22 percentage points. In quintile 4, where the standard deviation averaged 21.53, the active managers outperformed the index by an average of 1.98 percentage points. The middle quintile showed very modest outperformance (35 basis points), and in the more benign investment periods, the index beat the active managers by 25 basis points (quintile 2; 14.35 average standard deviation) and 50 basis points (quintile 1; 10.80) respectively.
Expenses and manager ownership
But of course small cap is a small piece of the overall market, and in particular a place where even passive proponents suspect that inefficiencies might be hiding in the shadows.
A much broader research initiative was undertaken by the Capital Group, which administers the American Funds. There are actually two studies of note, both of which focused on the second category of research: potentially better ways to select funds that might outperform their index benchmarks.
The first study examined the benefits of screening for funds with low expense ratios (which, it should be noted, is a major characteristic of many passively-managed portfolios) plus high rates of manager ownership – that is, where managers invest more of their own money in their own funds. (This latter information can be found in SEC filings and is tracked by Morningstar.)
The Capital Group researchers divided all U.S. equity and international equity funds into four groups: 1) all funds (2,466 U.S. equity and 571 international equity); 2) those that fell into the lowest cost quartile for their respective peer groups; 3) those that had the highest manager ownership quartile (meaning that 55% or more of the assets in the fund family complex had at least one portfolio manager who had invested at least $1 million in the fund); and 4) the 85 U.S. equity funds and 20 international equity funds that ranked in the top quartile by both measures.
Then they looked at the percentage of each group of funds that outperformed their respective indices, over five- and 10-year rolling periods going back 20 years, from January 1994 through December, 2013.
The results for the total universe of funds were about what you’d expect: over rolling 10-year time periods, fewer than 28% of the U.S. and international equity funds outperformed the S&P 500 and MSCI All-World ex-USA indices, and fewer than 30% outperformed over five-year rolling periods.
Selecting the lowest-cost quartile funds, in aggregate, brought your odds of success up dramatically – to (you can hear the index proponents cheering) just below 50%.
But when you selected for the highest management ownership quartile, without looking at costs, something interesting happened: roughly 70% of the high-manager-ownership U.S. equity funds and more than 60% of the similarly screened international equity funds topped their indices over 10-year periods. The numbers were 70% and slightly over 50%, respectively, over five-year rolling time periods.
Combining the two screens provided even better results; 100% of the low-cost, high-ownership funds outperformed the indices over 10-year periods, and roughly 90% of the comparable international funds did likewise. Over rolling five-year periods, the odds of beating the benchmarks, using these two selection criteria, was over 75%.
But at what levels of risk? Later, the report showed that the funds in the top quartile of both screens had higher rolling five-year Sharpe ratios than all active funds and, surprisingly, the Sharpe ratios were also higher than the indices themselves.
This first research report is most applicable to investors in the accumulation phase of investing. A second Capital Group study looked at the challenges inherent when you invest for clients in the decumulating phase of life, where the retiree’s future lifestyle can be severely impacted by an untimely bear market. Indeed, the report starts off by illustrating the dreaded “sequence of return risk” by graphing the assets in a distribution portfolio (paying out 6% of the initial portfolio, starting in 1965, with a 3% inflation increase through the end of 2014) using actual returns of the S&P 500, and those same returns in reverse order. One hypothetical retirement portfolio soars, while the other runs out of money before the 30th retirement year.
For investors who are decumulating their retirement portfolios, the Capital Group researchers suggested using the same fund selection criteria as the first study, and then adding one more screen: low downside capture – helpfully translated as: “funds that historically have outpaced indexes during market downturns.”
Can one spot this characteristic before a downturn? Looking at data going back to 1973, the Capital Group researchers found that the funds with the lowest three-year downside capture rate just prior to the start of a bear market outperformed the indices over the course of the downturn – in 11 of 12 problematic markets. The outlier was the tech bubble bear market of the early 2000s, where a heavy commitment to tech stocks provided a great downside capture ratio right up until it didn’t.
Once again, the study looked at the 1995 through 2014 time period, but this time the universe was divided into four asset classes: U.S. large cap (2,508 funds, benchmarked against the S&P 500); moderate allocation stock and bond (341 funds benchmarked against a 60% S&P 500, 40% Barclay’s Aggregate index); foreign large cap (600 funds, benchmarked against the MSCI All-Country World Index); and world allocation (128 funds, benchmarked against a 60% weighting of the MSCI All Country World Index and 40% Barclay’s Global Aggregate Index).
Each asset class was divided into three groups: the total universe; the funds with the best quartile downside capture ratios in the three years before the rolling period observations were taken; and funds that ranked in the top quartile of all three traits: lowest quartile expenses, highest quartile manager ownership plus lowest quartile downside capture.
Then the research team looked at rolling 10-year time periods, but with a twist: they assumed that each category was invested in a retirement portfolio with an initial 4% withdrawal rate, increasing by 3% for inflation each year thereafter.
Under this decumulation scenario, how many of the funds outperformed their benchmark indices?
In all but one category, the universe of active managers produced, in aggregate, a dismally losing record: 24.79% of the U.S. large cap funds created a superior decumulation portfolio than the indices over rolling 10-year periods. Even fewer, 14.88%, of the moderate allocation funds outperformed their benchmark, and just 23.97% of the foreign large cap funds crossed the finish line ahead of their index. The outlier, with a 57.02% decumulation outperformance rate, was the world allocation funds. For the most part, it appears that retirees should not be throwing darts at the mutual fund board if they’re looking for excellent results.
But when the Capital Group researchers combined the three screening criteria, they found that all 52 of the top quartile manager ownership/lowest quartile expense/lowest quartile downside capture U.S. large-cap funds produced better portfolio results than if someone had invested in the costless S&P 500. 100% of the 23 moderate allocation funds that passed the three screens outperformed their benchmarks, and the same was true of all seven funds in the world allocation category. In the foreign large cap sector 69.42% of the 47 funds would have produced higher portfolio values than the benchmark.
Once again, standard deviations were lower and Sharpe ratios were higher for the funds with the three selection characteristics.
What does active share versus tell us?
Passive proponents might suggest that researchers at active management fund shops are not the most impartial research cohort. So let’s turn our attention to one truly academic study that has gotten a lot of attention, published in the July/August 2013 issue of the Financial Analysts Journal; It fits firmly in the second category of research, and suggests that finding outperforming active managers may be simply a matter of identifying whether their portfolios are truly active.
The author, Antti Petajisto, who at the time of the research was a professor at the NYU Stern School of Business, and now (ironically) is a vice president at leading ETF provider Blackrock, found that most mutual funds are actually closet indexers; meaning that a large percentage of their holdings (more than a third of the aggregate) track the index benchmark that investors are paying them to beat. Moreover, Petajisto found that the average level of active management actually goes down during periods of high volatility.
Overall, the initial part of the study offered an explanation for what the SPIVA Scorecard consistently tells us: that, on average, actively-managed funds have underperformed the benchmarks by approximately the amount of their fees.
But then Petajisto focused his attention on the most active stock pickers, the farthest from the closet indexers – and found something that advisors on either side of the active/passive debate will find interesting. These “high active share” funds, in aggregate, beat their benchmarks by 1.26% a year after fees and expenses.
To reach this conclusion, Petajisto assigned an active share percentage to 2,740 funds over the 1980-2009 time period, and divided this universe into different categories according to strategy. The categories included “stock pickers” (T. Rowe Price Mid-Cap Value’s 93% active share is the example cited); “factor bets” (the report cites LongLeaf Partners Small Cap’s 99% active share as an example); funds with “concentrated holdings;” “moderately-active” funds that have active share in the 80% range; and “closet index” funds whose active share was calculated to be somewhere below 60% of the portfolio. One of the most interesting pieces of data in the report, regardless of where you stand on the active/passive debate, is the conclusion that 180 of the 1,124 funds are closet indexers, and those funds, taken together, hold a near-majority of the aggregate assets. As funds get larger, they tend to hold more index-like positions, and asset-weighted performance in the active world leans hard toward index returns minus the fees.
Petajisto found that the funds with concentrated holdings, in aggregate, failed to beat their benchmark, net of fees, by about 25 basis points a year, and factor-bet funds did somewhat worse. The closet indexers (again net of fees) tended to underperform their benchmarks by 91 basis points, worse than the moderately-active funds (52 basis point underperformance). The sweet spot was the highest-active-share funds in the stock picker category, which, on average, beat their benchmarks by 126 basis points a year, net of fees.
If you account for fund size, then identifying potentially outperforming funds gets easier. The smallest quintile funds in the stock-picker category with high active share outperformed their benchmark, net of fees, by 184 basis points a year. Meanwhile, at the other end of the spectrum, the closet index funds were uniformly underperforming regardless of size.
But did this performance advantage persist for individual fund managers, year over year? In a separate analysis, Petajisto found that the concentrated funds tended to have the most track-record-predictable performance, with those that outperformed in one year tending, on average, to beat those that underperformed by 10.04%. But there were also persistence advantages among the stock pickers and factor-bet mutual funds. Those managers who delivered alpha in one year tended to do so in subsequent years, and those who greatly underperformed did so predictably – which, of course damaged the track record of the group as a whole.
Fiduciary screens
Dr. Phillips’ investigation of the fi360 scores falls into the same category of research as the Petajisto study: How do you identify mutual fund outperformers in advance? But his criteria were completely different, and offered a different insight into a selection methodology that Morningstar’s Don Phillips has been advocating for decades. Phillips, in his early speeches, invited his audiences to divide fund managers (and companies) into two sharply-differentiated categories:
- those who had a passion for active management, whose priority was to provide a better investment performance experience for their shareholders; and
- companies that excelled at marketing and creating products that tapped into the latest investment fad, which prioritized maximizing their own revenues and profits, sometimes (see: the late-trading scandals involving Putnam, Strong, Nations Funds et al.) putting their own interests clearly ahead of the interests of their investors.
Ideally, you would want to own the former rather than the latter, and theoretically, the former would deliver a better return experience than the latter. But these are qualitative issues. How do you measure them?
The fi360 scorecard tries to match up fund selection criteria with the general outlines of the Uniform Prudent Investor Act and the fiduciary obligations in ERISA as interpreted by the U.S. Department of Labor. The result, perhaps accidentally, is not far from what Don Phillips has been proposing all along; the funds that fall into the scorecard’s green (top quartile) category – the most procedurally “prudent” funds to recommend – tend to also fit the description of managers and companies who prioritize shareholder returns over a variety of self-interests.
And the returns suggested that this made a difference. Dr. Phillips found that funds that had achieved green rankings in the fi360 screening process generally outperformed the funds in the red (lowest quartile scorecard score) by 133 basis points over the next three years, and 365 basis points over the subsequent five years.
There are actually four ways to calculate the scorecard scores: as of the moment, or using the average one-year, three-year and five-year scores from prior years. Phillips looked at the bigger picture, and ranked the performance of all four colors as selected by each of the four selection criteria (giving him 16 criteria in all), from highest to lowest. He found that the green funds ranked numbers 1, 3, 4 and 6 in overall returns. Light-green funds ranked numbers 2, 7, 8 and 9; yellow funds ranked 5, 10, 11 and 12, and the red scores ranked 13, 14, 15 and 16. The green funds also achieved the three lowest standard deviation and semi-deviation scores, and four out of the lowest six.
But what about the persistence of the scorecard scores? Phillips looked at the fiduciary rankings from January 2000 through March of 2013, which consisted of 800,000 total observations, and found that funds tended to stay in or near their categories from year to year, decade to decade. Combine that with a follow-up study updating results to January 2015, and the conclusion is that the funds in fi360’s top fiduciary quartile remained in the top quartile in almost exactly 65% of the subsequent years, and 23% of the time a green fund would drop slightly and become a light green fund in the following year. Light-green funds had a 37-39% persistency as light-green, and a 25% chance of moving up to green status.
The red funds, meanwhile, showed similar consistency. In all, 56-59% of funds in the red quartile remained there from one year to the next, and only about 1% achieved green status in the following year.
Stoplight criteria
Dr. Phillips’ response to this rather shocking refutation of the efficient market hypothesis was to wonder whether there were other breadcrumbs that investors could follow in their search for unusually high-achieving active managers. He had a practical reason for wondering; in his spare time, Phillips is founder and “chief scientist” of MacroRisk Analytics, a software program which, among other things, correlates changes in different economic factors with stock, fund and ETF behaviors.
In the past, the program had hewn pretty much to the efficient market line; the main benefit of having this correlation data, as Phillips saw it, was to create portfolios that were as resistant as possible to unforeseen economic shocks – that were, in other words, made up of combinations of stocks and/or funds whose composite behavior would be less correlated with jittery economic data like housing starts, currency fluctuations, shifts in employment, inflation, energy prices, auto sales, the money supply and the price of gold.
Now, Phillips began to wonder whether the massive data in his software system couldn’t provide an additional benefit. “The question we started asking ourselves,” says Phillips, “is: what tools in our dataset would help advisors know which would be the best mutual funds to buy on a five-year horizon?”
The first few inquiries went nowhere. “We found, as the theory tells us,” says Phillips, “that long-term, the values of returns are essentially unpredictable.” Nor could the values of standard deviations and other volatility measurements be reliably projected into the future.
“But when we looked at the Sharpe ratios, the relationship between those two numbers became somewhat more predictable,” Phillips, says, adding: “Though it was still not so predictable that I would want to make portfolio bets using it.”
What else could you do with this information? “I do a lot of work in some of my other research on what are called non-parametric statistics,” Phillips explains – meaning statistics based not on numerical values, but on the consistency of the ranking of those values from one time period to the other. “I was wondering how I could apply that to what I was finding,” he says, “and then suddenly something came together for us. We found that while the numbers themselves were unpredictable, and the ratios of the numbers were only somewhat predictable, there was strong statistical support that the rankings of the funds’ Sharpe ratios was consistent over time.” The most useful categorization found that the funds with Sharpe ratios in the upper third of the fund universe in one time period tended to remain in the upper third over subsequent time periods.
Following the fi360 color nomenclature, Phillips designated the upper-third Sharpe ratio funds as green, the middle third as yellow and the bottom third as red. The updated version of MacroRisk’s software calls these, collectively, the Stoplight feature. Each fund, stock and ETF is assigned two Stoplight colors, one for equity, and the other for non-equity, with the second metric calculated so as to accommodate investments like individual stocks, bond funds and funds that invest in commodities, real estate and liquid alternative strategies. The software can also assign a color to an advisor’s portfolio combinations of different assets.
But is this useful information for an investor? In the most recent analysis, Phillips created portfolios invested in all the funds that achieved the highest Sharpe ratios over the previous three years, each year from January of 2000 through the end of 2010, with five-year holding periods. The green funds generated an aggregate 10.61% return, compared with 2.49% for the S&P 500.
Phillips then looked at investment performance from July 1, 2010 through July 1, 2014, and once again Stoplight’s green funds outperformed the index, with an annualized return of 19.18% and a 13% standard deviation vs. 15.22% and 15% standard deviation for the S&P. The funds in the red category (lowest Sharpe ratio over the previous years) delivered underperforming returns: 13.20% a year with a 25% standard deviation.
Conclusions? Not yet.
What does this prove? Proponents of index fund investing would say “nothing,” and that conclusion is probably accurate. Just as the academic research that follows the efficient market hypothesis has failed to prove that it is impossible to select above-average funds in advance, the new research cannot prove that anybody can do it reliably. Furthermore, advisors in the passive management camp can argue that even if the active-share research, fi360 fiduciary scores and Stoplights are helpful in identifying better managers, the time and energy involved in applying these tools can eat up more value in terms of the advisor’s time than they will produce in client portfolio returns.
Nevertheless, the indexing phenomenon is starting to shift from a niche part of the investing world into mainstream and, if the inflow/outflow data remains consistent, may be crossing the line into “fad” territory. History suggests that fads have a way of playing themselves out by delivering unpleasant consequences.
At the very least, the new research should cause advisors to question whether the efficient market hypothesis – and the academic research that informs us over and over again of the (rather low) odds of hitting an outperforming fund on a dartboard – are telling us the whole story. As our marketplace evolves more sophisticated tools, and those tools have access to better data, the quixotic hope of identifying superior future track records may be less daunting than we once believed. We’ll get better at knowing where and when to look, and at the looking process itself.
We can come to that tentative conclusion even before we examine the ultra-sophisticated fund selection techniques created by Dan Kern at Advisor Partners and a very different process created by Gary Miller at Frontier Asset Management.
That will be the subject of the next part in this series of articles.
Bob Veres’s Inside Information service is the best practice management, marketing and client resource for investment advisors and financial planners. To get a free sample issue of Inside Information, send your request to [email protected], or order online at http://www.bobveres.com.
Read more articles by Bob Veres
 Is it really impossible to find outperforming mutual funds in advance? It depends on where, and how, you look.