The quest for yield has led to high valuations for dividend stocks and boom times for equity income funds. The problem comes when investors use dividend strategies too aggressively or as a cure-all substitute for financial planning, asset allocation and risk management. But there are certain guidelines that have proven to deliver superior results when constructing a dividend portfolio.
The popularity of dividends is waning. Recent data for equity-income funds shows outflows and lagging fund performance. As interest rates rise and as the economic outlook becomes more conducive to growth, valuations are likely to come under further pressure.
I will look at the underlying justification for a dividend-based strategy and at how the most popular funds have performed recently. I will then discuss the criteria that investors should use to construct the best dividend-oriented portfolio.
Dividend zealots
I’m a fan of dividend stocks. In fact, I used them liberally for my mom’s retirement portfolio, since dividends make sense when growth is sluggish and bond yields are low.
But I recognize the limits of the strategy. This is not a message that everyone wants to hear:
I have come to learn that Dividend Growth investors, which have also been disparagingly referred to as Dividend Zealots, are among the most optimistic investors in the universe. And in many ways, perhaps the most misunderstood. Dividend Growth investors often state that they are not concerned with drops in the price of their stocks, but only that their dividends grow. For some reason, this offends certain people who apparently feel that this makes Dividend Growth investors arrogant and/or even ignorant.
What these detractors misunderstand in my judgment, is that the average Dividend Growth investor does not worry about short-term volatility because they do not intend to sell. Dividend Growth investors buy in order to hold quality dividend paying companies for the long run…”
Chuck Carnevale
NewsFlash: The Dividend Aristocrats Found The Lost Decade
Unfortunately, investors cannot ignore short-term volatility just because they “don’t intend to sell.” Life has a way of surprising us with events that suddenly require liquidity. A dividend investor could be a forced seller in a bear market, and these losses are never recovered.
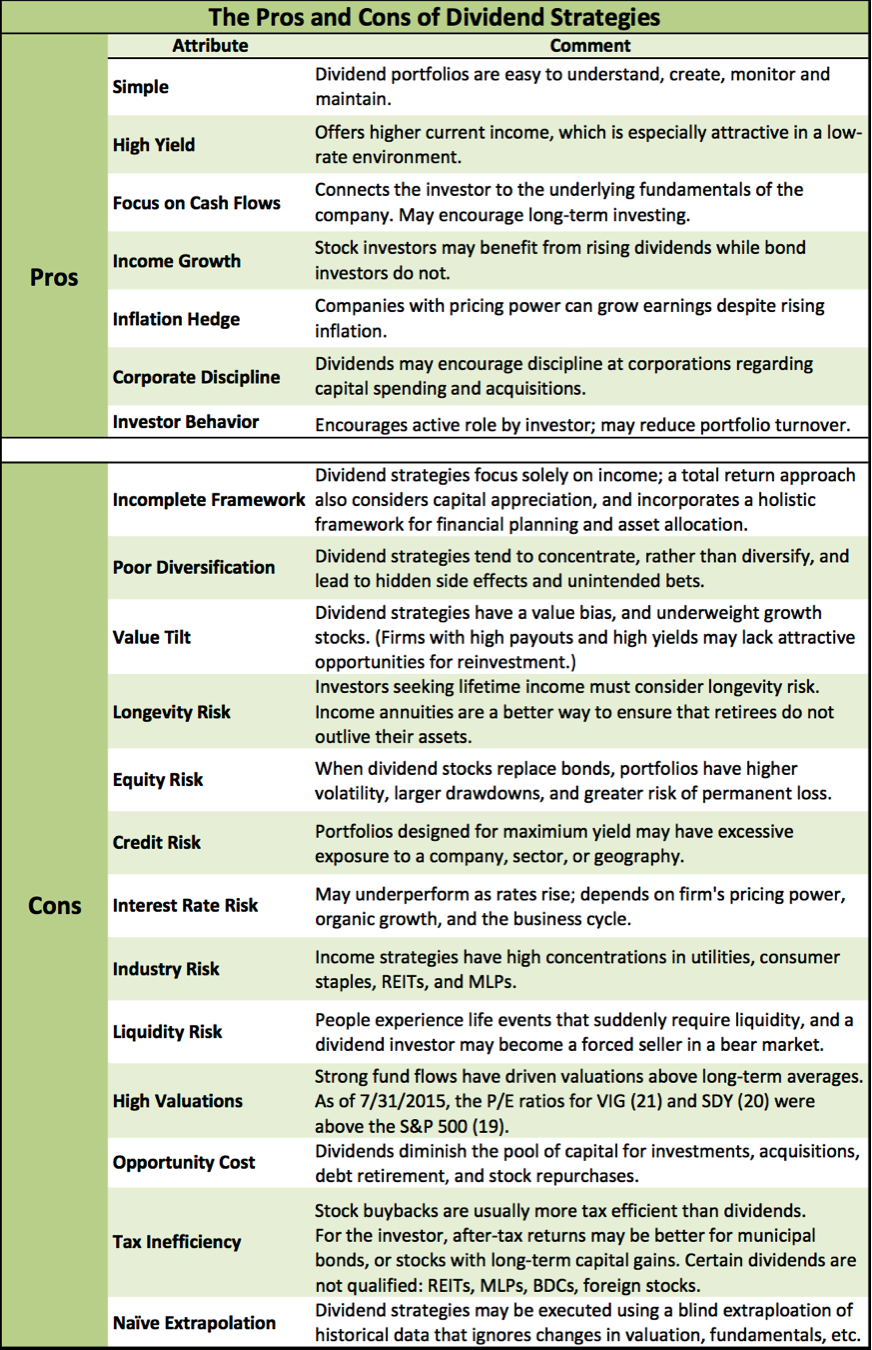
The pros and cons of dividend strategies
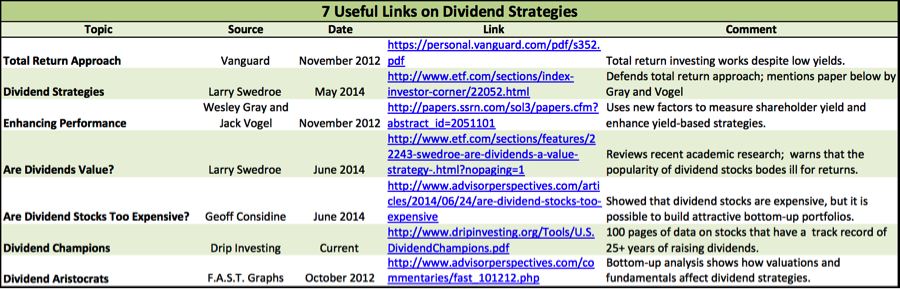
The first table below summarizes the pros and cons of dividend strategies from an advisor’s perspective. Dividend strategies can be elegantly simple; they can be easy to design, execute and explain to clients. There is an active community of dividend investors who share resources, which are shown in the second table below.

Source: Right Blend Investing, LLC
The biggest challenge for dividend strategies is that they are no substitute for holistic, goals-based wealth management. Dividends are useful screening criteria, but are no excuse for ignoring financial planning, asset allocation and risk management. My experience with “dividend zealots” is that they overlook other financial solutions, such as income annuities, an excellent product for retirees seeking lifetime income. (See Wade Pfau’s article: Why Bond Funds Don’t Belong in Retirement Portfolios.)
As discussed in papers by Vanguard and Larry Swedroe, investors are better served by a total-return approach to investing. A total-return approach is indifferent to whether returns come from dividends, coupons or capital appreciation; all are equally desirable (at least on a pre-tax basis). By definition, this process results in a more robust portfolio than putting 100% of investable assets into dividend stocks.
A total-return approach also considers risk management, even though investors are becoming less concerned about risk as memories of the crash of 2008 fade. A long bull market has led to high valuations for dividend stocks, creating additional downside potential when a correction comes.
This is why the table lists a lot of “cons.” I like dividend strategies. But many investors are ignorant of the risks involved or underestimate the negative consequences after a long bull market.
Returns and flows
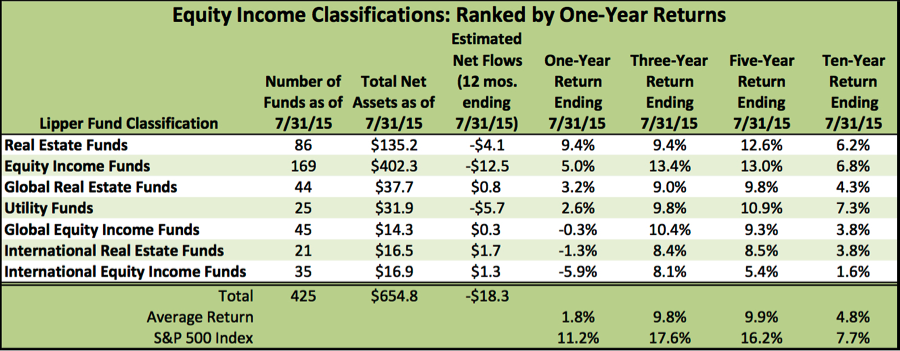
The table below shows the returns for various Lipper classifications of equity-income strategies. These include dividend strategies, most of which are included in the Equity Income Fund classification. Of the seven classifications shown, Equity Income Funds is the largest by far, accounting for over 60% of assets as of 7/31/15.
Sources: Lipper, a Thomson Reuters company, Vanguard, Right Blend Investing, LLC
Notes: Performance shown is for primary share classes, and historical data include closed funds. "Average Return" (at bottom of table) assumes an equal weight for each of the 7 Lipper fund classifications.
Returns for each of these classifications lagged the S&P 500 during the one-year, three-year, five-year and 10-year periods. Dividend strategies did not outperform the market during this time frame, though some academic studies have shown that dividends are a value approach that generates alpha. (For a thorough discussion of dividends and returns, I recommend the 2014 Advisor Perspectives paper from Geoff Considine, founder of Quantext.)
Estimated net flows for these funds turned negative during the 12 months ending on 7/31/15. Net flows for all seven classifications were -$18.3 billion, including -$12.5 billion for Equity Income Funds. This is a turnaround from 2014, when all seven classifications had positive fund flows, with a total of $36.1 billion, including $8.9 billion for Equity Income Funds. The reversal of flows from positive to negative shows that dividend strategies are falling out of favor.
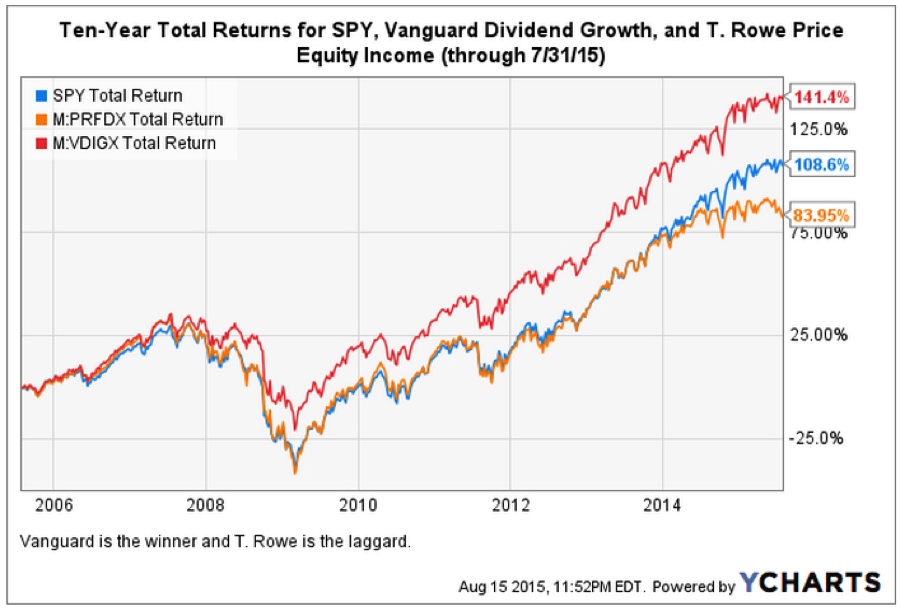
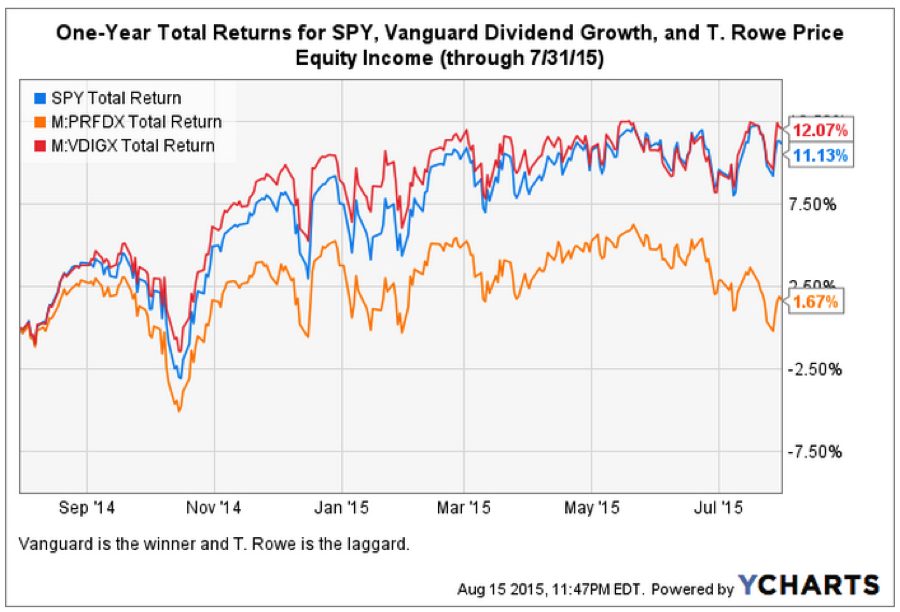
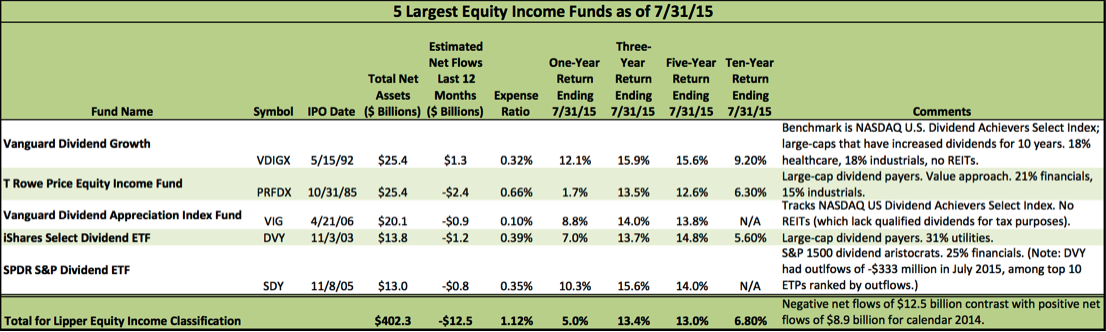
Turning to the five largest funds in the Equity Income classification, a similar pattern emerges. Most of the funds lagged the S&P 500, except for the Vanguard Dividend Growth Fund (VDIGX). This fund focuses on stocks with a record of at least 10 years of increasing dividends, and it has an expense ratio of only 0.32%. VDIGX returned 12.1% over the last 12 months vs. 11.2% for the S&P 500. VDIGX also beat the market over the last 10 years, with returns of 9.2% vs. 7.7% for the S&P 500. VDIGX holds high-quality companies with modest growth in dividends, and it fared well in 2008. The fund excludes REITs, and this may have also helped long-term performance.
The long-term chart of VDIGX shows the extent of its outperformance versus the S&P 500 over the last 10 years. The second-largest fund is the T. Rowe Price Equity Income Fund (PRFDX), which has lagged the market for each of the time periods studied. (See charts below.)
The performance of PRFDX diverged sharply from the S&P 500 during 2015. This trend was also evident in other large dividend funds, both actively and passively managed. One reason for the divergence is the large holdings of REITs and MLPs. The divergence may also be due to investor concerns about rising rates, which may help explain the outflows from dividend strategies.
Sources: Lipper, a Thomson Reuters Company, Right Blend Investing, LLC, fund fact sheets.
Notes: Total Net Assets are for primary share class only. Returns for the Lipper Equity Income Classification include closed funds, and attempts to minimize survivorship bias.
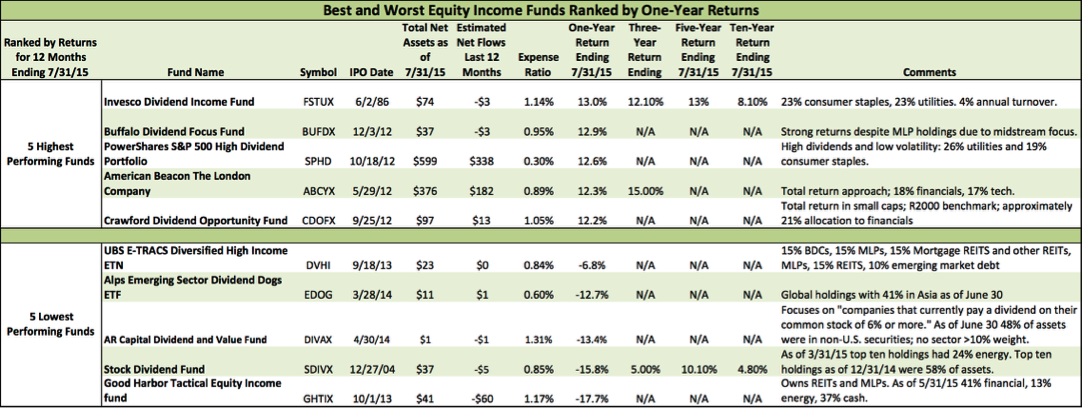
The best and worst equity income funds showed a wide range of returns: Returns in the five worst performing funds ranged from -6.8% to -17.7%, while those of the five best performing funds were between 12.2% and 13.0%. These are smaller funds, and most of the return variance is explained by sector concentrations. Funds with exposure to REITs and energy stocks fared poorly over the last 12 months, as did funds with foreign-stock exposure.
Sources: Lipper, a Thomson Reuters Company, Morningstar, Right Blend Investing, LLC, fund fact sheets.
Notes: Performance ranking is based on primary share class for each fund. Total assets and estimated net flows are in millions. There were 169 funds in the Equity Income Fund classification as of 7/31/15.
The total net assets for the Stock Dividend fund are as of 12/31/14 and net flows are estimated. The total net assets for the Alps Emerging Sector Dividend Dogs ETF are as of 8/13/15.
There is little here to suggest that active management adds value when choosing dividend funds, and there is much to suggest that chasing high-yield stocks eventually backfires. The bottom-performing funds had high weightings in MLPs, BDCs and REITs. One of the lessons that emerges below is that the highest-yielding stocks generally produce the lowest returns. This came out of research by Marc Gerstein of Portfolio123.com.
Gerstein tested a number of dividend selection strategies and found that the highest-yielding stocks tend to underperform. Apparently, the market is very efficient at identifying firms with unsustainable dividends, so it makes sense to exclude stocks with yields above a certain level. (I am not aware of any equity income fund that puts a “cap” on dividend yield, so investors are left to fend for themselves and create their own portfolios.)
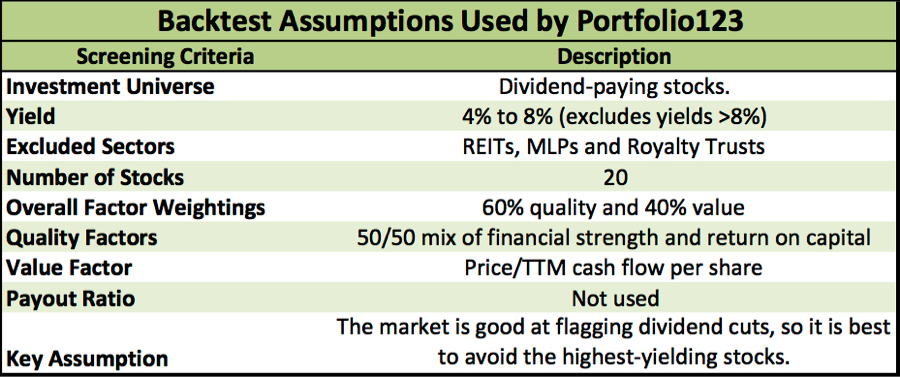
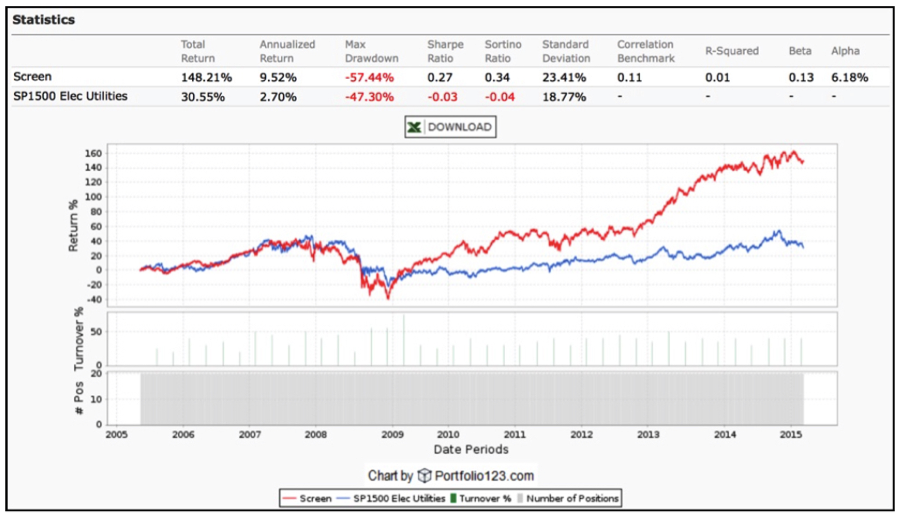
Based on Gerstein’s preliminary findings, he ran a backtest to measure the performance of dividend-paying stocks with certain characteristics. Gerstein noted that the criteria (shown below) are subjective, but he avoided the “data-mining and curve-fitting trap.” His goal was to build a screen that would work with out-of-sample data (i.e., live performance).
Source: Portfolio123.com presentation, June 18, 2015
A naïve application of a dividend-based strategy leads to concentration of risk and unintentional side effects. It is therefore worth creating a basket of dividend stocks to offer clients. The goal would be to offer low costs, high transparency and active risk management; the potential for higher risk-adjusted returns would be an added benefit.
Implementation of a dividend basket would be easier for advisors who have a unified managed account (UMA) platform. If the advisor has access to a “rep as PM” program, the dividend basket could be a separate sleeve that sits alongside ETFs and mutual funds.
The results of the backtest (below) show 10-year cumulative returns of 148% for the period ending June 1, 2015. This is similar to the 141% posted by VDIGX for the 10 years ending July 31, 2015. Although these results are not directly comparable, the construction of VDIGX and the backtest from Portfolio123 are very similar. Both emphasize other factors in addition to dividend yield: financial strength, earnings quality and sustainability. This process does not generate the maximum current yield, but it does generate better long-term returns.
Backtest of Dividend Screen by Portfolio123:
Excludes Highest Yielding Stocks
Source: Portfolio123.com presentation, June 18, 2015
Looking ahead
As we contemplate the impact of rising rates on dividend strategies, consider the market conditions that are driving the Fed to act. Tony Rodriguez, Co-Head of Fixed Income at Nuveen, recently described the outlook in Fixed Income in a Rising Rate Environment. Rodriguez characterizes today’s economy as one of:
- High credit spreads
- Moderately steep yield curve
- Normalization after unprecedented accommodation
- Divergent global growth
- Divergent inflation trends
The Fed is not tightening to fight domestic inflationary pressures, so rate hikes are likely to be slow and modest. The impact on interest rates will be felt more sharply on the short end of the yield curve.
If this view is correct, economic growth is likely to continue to muddle along, earnings growth will continue in the mid-single digits and growth stocks will garner a premium. This is an environment where growth is likely to outperform value, especially if rising rates give yield-hungry investors more options at the short-end of the curve.
Right now, cash pays virtually nothing, and the normalization of interest rates would drain some of the appetite for income investments. This appetite has driven dividend stocks to high valuation levels, and this is now reverting to the mean as cash moves out of aggressive dividend strategies. Thus, it makes sense to consider more conservative dividend strategies that are high quality and diversified, rather than strategies that are high yield and concentrated.
All things considered, VGIDX is attractive. It is low-cost, well diversified, has a strong track record and is well positioned for a rising rate environment. Sometimes a simple solution is the best solution.
Robert J. Martorana, CFA has been an investment professional since 1985. He owns Right Blend Investing, LLC, which focuses on institutional research of liquid alternatives. He is the co-author of Alts Democratized.
Disclaimer
All written content is for information purposes only. Opinions expressed herein are solely those of Right Blend Investing and our editorial staff. Material presented is believed to be from reliable sources. However, we make no claims to its accuracy or completeness. All information and ideas should be discussed in detail with your individual adviser prior to implementation. The presence of this article shall in no way be construed or interpreted as a solicitation to sell or offer to sell investment advisory services to any residents of any state other than the state of New Jersey or where otherwise legally permitted. This is not a complete discussion of the information needed to make a decision to open an account with Right Blend Investing, LLC. There are always risks in making investments, including the investment strategies described.
Right Blend Investing, LLC is a registered investment advisor in the state of New Jersey. There are always risks in making investments, including the possibility of losses. NO BANK GUARANTEE. MAY LOSE MONEY.
Read more articles by Robert J. Martorana