Advisor Perspectives welcomes guest contributions. The views presented here do not necessarily represent those of Advisor Perspectives.
Many traditional value investors have concentrated portfolios of less than 50 names. Many index funds that tilt toward value factors have portfolios that consist of hundreds of names. This begs the question: What is the best portfolio size for value investing?
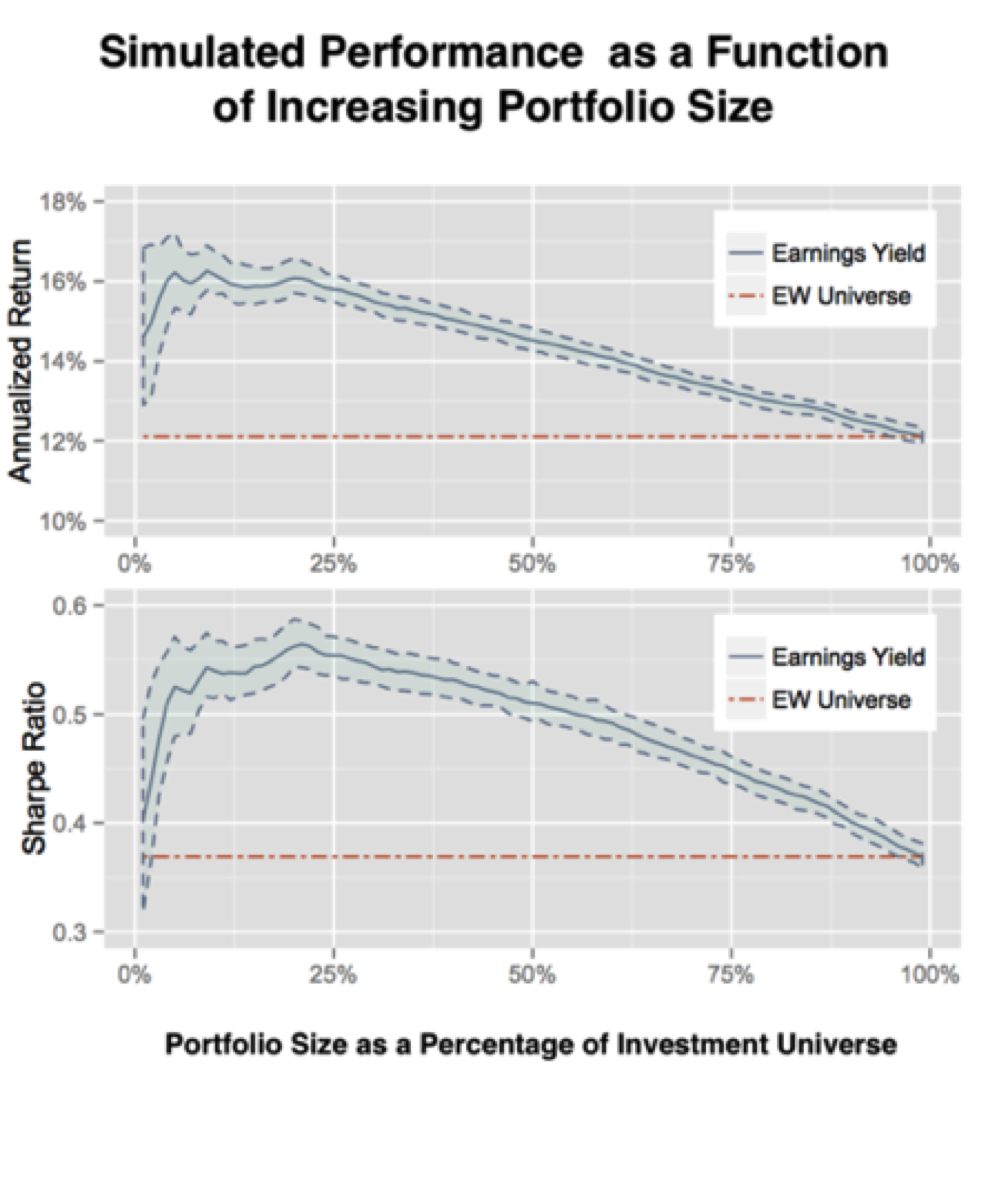
We performed a simulation to examine portfolios of various sizes where holdings were selected on the basis of their earnings yields. Earnings yield here is a company’s trailing annual earnings before interest and taxes, divided by its enterprise value. In order to show a distribution of simulated outcomes, each portfolio size reflects 100 simulations using a random sample as described in the appendix. In the charts, EW Universe represents a simulation of the performance of an equal-weight allocation to each stock in the entire universe used in the simulations.

Here are some of our findings:
-
While not shown on these charts, the simulated equal-weight return of approximately 12% is higher than what the market-cap weighted S&P 500 actually delivered across the 40 years of this study. We are intrigued by this result, particularly given the mass of investors who hold market-cap weighted indices. Here is a paper that looks at the performance of equal-weight portfolios.
-
Across the 40-year simulation period, any effort to select cheap companies and eliminate the most expensive companies would have raised the expected return above what would have been achieved by equally weighting (or market-cap weighting) assets across the entire market.
-
If using earnings yield alone, you would have wanted to own at least 15% to 20% of this universe (or 200 to 300 names) to maximize your expected investment performance. The implication is that you would need to have some more powerful perspective about a company than its inexpensiveness (as measured by earnings yield) in order to intelligently hold a more concentrated portfolio.
-
And, these results beg an important question: What is it about the most inexpensive companies that pulls down the median return of the most concentrated portfolios?
At Euclidean, we manage a portfolio with approximately 50 holdings. To do this with confidence, we invested our energy in understanding what gives companies their value. Our goal is to avoid companies that are deservedly cheap and to invest in companies where their market price underappreciates their intrinsic value.
Appendix
In the simulation, Standard & Poor’s COMPUSTAT database was used as a source for all information about companies and securities for the entire simulated time period. The universe of companies used in the simulation included only NYSE, AMEX and NASDAQ traded companies. Non-US-based companies, companies in the financials sector and companies with a market capitalization that, when adjusted by the S&P500 Index Price to January 2010, is less than 400 million dollars were excluded from the universe. The median historical size of this universe was approximately 1,500 companies. The label "EW Universe," used in the charts above, represents a simulation of the performance of an equal weight allocation to each stock in the entire universe. The period of simulation used was from January 1973 to December 2014, inclusive. The simulation results reflect assets-under-management (AUM) at the start of each month that, when adjusted by the S&P500 Index Price to January 2010, is equal to $100M.
One hundred simulations were run for each portfolio size to create a source of variation and hence a distribution of returns for each portfolio size. The source of variation in the 100 simulations came from using a different random subsample of 70% of the entire universe.
Portfolios were constructed and rebalanced according to the following rules: All companies in the universe (described above) were ranked according earnings yield. Earnings yield is defined as EBIT divided by Total Enterprise Value. At the start of each month, companies who are not in the portfolio and whose earnings yield ranks higher than the target portfolio size are bought. New positions are established with a target weight of 1 divided by the target portfolio size (i.e., equal weight). The ability to achieve the target weight is modulated by available liquidity from cash, selling, and dividends. All simulated returns also include the reinvestment of all dividend income. Companies that have been owned for more than one year and whose earnings yield does not rank higher than the target portfolio size are sold. The amount of shares of a security bought or sold in a month was limited to no more than 10% of the monthly volume for a security.
From 1983 to present, the purchase and sale price of a security was based on volume weighted daily closing price of the security during the first ten trading days of each month. Prior to 1983, when daily pricing is not available for all securities, the purchase and sale price of a security was based on the monthly closing price of the security.
Transaction costs are factored as $0.02 per share plus an additional slippage factor that increases as a square of the simulation’s volume participation in a security. For example, if participating at the maximum 10% of monthly volume, the simulation buys at 1% more than the average market price or, conversely, sells at 1% less than the average market price. Other than these transaction costs, the simulated results do not reflect the deduction of any management fees or expenses.
Historical simulated results presented herein are for illustrative purposes only and are not based on actual performance results. Historical simulated results are not indicative of future performance.
Mike Seckler and John Alberg are the managers and founders of Euclidean Technologies Management, an investment firm that applies machine learning and systematic approaches to value investing. John and Mike have worked together for over 18 years. Prior to starting Euclidean in 2008, John and Mike co-founded Employease, a software-as-a-service provider that was acquired by Automatic Data Processing (NASDAQ:ADP) in 2006.
Read more articles by John Alberg and Michael Seckler