Since 2008, I have posted a template for a client letter each quarter as a starting point for advisors who want to
send clients an overview of the period that just ended and some thoughts looking forward.
Since 2008, I have posted a template for a client letter each quarter as a starting point for advisors who want to
send clients an overview of the period that just ended and some thoughts looking forward.
This quarter’s letter addresses one of today’s most taxing questions for advisors and investors alike:
How to deal with the quandary presented by today’s valuation levels on U.S. stocks.
To answer that question, I’ll look at what several market experts have to say. Some think stocks are too
expensive, and others believe they are fairly valued.
How to win multi-million dollar clients
Tired of ho-hum conference speakers? Dan Richards delivers leading edge keynote talks on what it takes to
attract high end clients today.
To energize your next conference, click for more information on Dan’s
speaking topics and to hear from past clients.
Dan Richards
ClientInsights-President
6 Adelaide Street E, Suite 400
Toronto ON M5C 1T6
(416) 900-0968
This letter runs longer than normal, so feel free to delete any sections that are not appropriate for you. As
always, be sure to customize the letter to reflect your views.
The first half in review: Today’s big question for investors
In this review of the first half of 2015, I address one of today’s biggest questions for investors: Do U.S.
stocks at today’s levels still offer value?
But first an overview of performance in the first half of 2015.
The U.S. market moves sideways – and global markets gain ground
In 2013 and 2014, the U.S. stock market substantially outperformed the rest of the world. In the first half of 2015,
our market gave back some of that outperformance against Europe and emerging markets.
Annual Returns in Local
Currency |
U.S. |
Europe |
Emerging
Markets |
World
Markets |
| 2012 |
16% |
16% |
17% |
16% |
| 2013 |
33% |
22% |
4% |
26% |
| 2014 |
13% |
5% |
6% |
10% |
| First Half 2015 |
1% |
8% |
6% |
5% |
| Source: MSCI, January 1 to June 30 2015, including dividends |
The dollar continued to show strength in the first half of 2015. This led to lower foreign returns when translated
into U.S. dollars though the rise in the dollar slowed compared to the dramatic increase in the second half of last
year.
Here’s what happened in the first half of 2015 in the US, in Europe and in China:
United States
The outperformance in foreign markets is not a reflection of lack of strength in the U.S. economy; after a slump due
to severe weather this past winter, the U.S. still leads the developed world in its growth. There are continued
positive signs in most traditional indicators of economic activity such as housing, auto and retail sales,
employment and capital goods orders by companies.
Outside of the energy sector, which has been hit hard by the drop in oil prices, 2015 corporate profits are expected
to show solid growth with profit projections upgraded from earlier this year. The one cloud on the horizon is the
impact of the stronger dollar, as the value of profits in overseas markets drops and some U.S. manufacturers find
themselves struggling to keep prices competitive.
Europe
Going into the second quarter, strong leadership by the European Central Bank improved the outlook for Europe’s
economies. As well, European multinationals have seen their competitiveness increase due to the fall in value of the
euro. Consumers have benefited from the drop in oil prices since the middle of 2014, with the prospect of stronger
consumer spending as a result.
Earlier this spring, there was a general sense that accommodation would be reached with the far-left anti-austerity
government elected in Greece.The latter part of June saw a confrontation between Greek’s leaders and its
European creditors, culminating with a referendum on July 5 in which voters rejected austerity measures associated
with a bailout proposal. There now appears to be the real possibility of a “Grexit” from the European
Union, which would mean Greece abandoning the euro as its currency.
European stocks and bonds will see volatility over the period ahead, although given that Greece’s economy is
about the size of Alabama’s and only makes up 1% of Europe’s economy, this will not have lasting effects
as long as instability does not spread to larger economies such as Italy and Spain. This New York Times article
provides background on how Greece got to this point and the implications for Europe as a whole.
China
While Greece has received lots of attention, the true wild card when it comes to global growth is China. After three
decades of 10%-plus annual growth (something never seen for an economy its size) and having helped fuel the recovery
after the global financial crisis, the growth of China’s economy is slowing to mid-single digits. China’s
uncertain growth prospects are driven by substantial overcapacity in its factories, the prospect of a sharp drop in
real estate prices and what appears to be a full-fledged bubble in stock valuations. Of note, stock prices doubled
in the seven months to mid-June, much of that driven by individuals borrowing to participate in a speculative
frenzy, before dropping by 25% in the next three weeks.
With that as background, let me turn to one of the big issues for investors today: if, after having tripled since
the market’s bottom in March of 2009, U.S. stocks still provide enough upside potential to justify their
downside risk.
The valuation quandary
In March, CNN ran a commentary
celebrating the sixth anniversary of the bull market in U.S. stocks markets. Any time that you see a largely
uninterrupted run up like that, inevitable questions arise about whether stocks still offer value.
In formulating recommendations for client portfolios, I look at a broad range of sources. I pay special attention to
experts who have been through multiple market cycles and have a superior track record. Someone I listen to, for
example, is activist investor and 50-year industry veteran Carl Icahn, known for his confrontations with company
management and for his 2013 profit of $850 million when he sold part of his stake in Netflix. This June Wall
Street Journal article, Carl Icahn
Says the Market is Extremely Overheated, described his concerns about stock valuations.
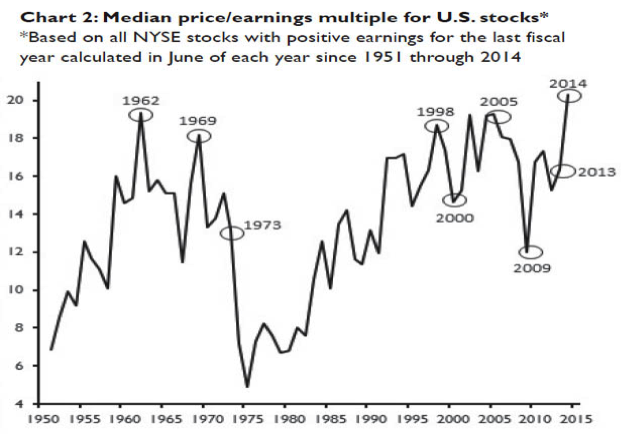
Average U.S. stock the most expensive ever
Icahn is not alone in his concerns. Earlier this year, a chart (replicated below) circulated showing the average
stock on the New York Stock exchange selling for the highest multiple ever, above levels before the tech bubble and
the global financial crisis.
Data Source: Kenneth French, Dartmouth College
Traditional market indices are weighted by a stock’s market value, so price movements by Apple at a market
value of $750 billion have three and a half times the impact of Coca-Cola at $200 billion and 35 times the value of
Marriott Hotels, whose market value is roughly $20 billion. In the chart above, every stock is given the same
weight, so that movements by Marriott count the same as Apple. What this chart reflects is that among the factors
driving the rise in stock prices, smaller and more speculative stocks have generally outperformed, as access to
cheap money has allowed some stocks to do well that otherwise might struggle.
A warning from a Nobel laureate
In my client letter at the beginning of this year, I pointed to a comprehensive study by Vanguard on forecasting stock returns that examined 15 popular
measures used to predict returns. While no measure had meaningful predictive power for the next 12 months, the best
predictor of future returns over the mid term used earnings for the previous 10 years adjusted for inflation, an
approach popularized by Yale’s Robert Shiller, recipient of the 2013 Nobel Prize for economics and someone who
predicted both the tech crash and the implosion of real estate prices.
Using 10 years of earnings, as Shiller suggests, the outcome is quite concerning: At the end of June, the U.S. stock
market was priced at 27 times average earnings for the past 10 years, more than 50% above the long term average of
16 times 10-year earnings. While this valuation does not approach the 44 times seen at the height of the tech
bubble, it does suggest that in the next 10 years, returns on U.S. stocks will likely be lower than their historical
average.
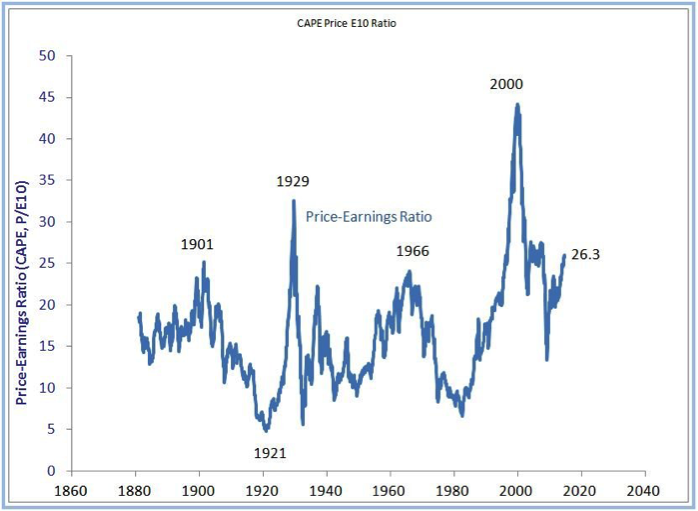
Here’s an excerpt and chart from an article from last
September based on an interview with Shiller:
"As of yesterday my price earnings ratio ... was 26.3," said Shiller. "There's only three major occasions in US
history back to 1881 when it was higher than that. One is 1929, the year of the crash. The other is 2000, which
I call the peak of the millennium bubble, and it was also followed by a crash. And then 2007, which was also
followed by a crash."
Source: Robert Shiller, Yale University
Shiller urged investors to be cautious, but also emphasized that this measure is not designed to time when to enter
and exit the market in the short term. He points out that even when high, the market can continue to rise, and the
market can also fall even when this measure is low.
The other view on valuations
Offsetting these words of caution are some respected industry participants who also bring many years of experience
and strong track records and argue that U.S. stocks are fairly valued. (It’s hard to find anyone who maintains
that stocks are cheap.)
Central to the “fairly priced” argument are today’s historically low interest rates. When rates
are ultra low as they are today, the present value of a dollar of earnings five and ten years from now is
considerably higher than if interest rates were 6% or 8%. Some industry participants use that to justify higher
valuations than the norm. This was the view
expressed by Wharton’s Jeremy Siegel, author of Stocks for the Long Run and today’s leading
authority on stock-market history.
Siegel’s sentiments were echoed by highly respected veteran Jeremy Grantham, historically a voice of caution.
In a recent talk, Grantham said that
while stocks are “creeping towards a bubble,” they aren’t there yet. While urging prudence and
caution, particularly given corporate profit margins at all-time highs, he suggested that the low interest
environment since the beginning of 2000 altered the traditional math on what constitutes fair valuations.
Even Yale’s Robert Shiller is scratching his head about U.S. stock valuations. Here’s an excerpt from a
recent Bloomberg
article:
What to make of Shiller’s CAPE ratio is controversial – even among supporters. A report earlier this
year from Russell Investments says it shows that the market is “outright expensive” versus a
long-term average of 16. Investor Jeremy Grantham, co-founder and chief investment strategist at Grantham Mayo
Van Otterloo & Co. in Boston, says one should look at the CAPE ratio’s average value of 24 since 1987.
(Note: A reminder that today this level is at about 26 times.)
…Can Mr. Shiller himself settle this debate? Nope. He sort of shrugs and throws up his hands. He says the
ratio that bears his name has made the market look expensive for a while, spurring some pundits to give pretty
bad advice.
Record-low interest rates around the world are rendering some long-held financial theories useless, he
says. “I’ve been very wary about advising people to pull out of the market even though my CAPE ratio
is at one of the highest levels ever in history,” Mr. Shiller told Bloomberg in April. “Something
funny is going on. History is always coming up with new puzzles.”
What this means for investors
Even experts who view the market as fairly priced urge caution. And being prudent and cautious is the same view that
I take in my conversations with clients. Being cautious means three things: keep your portfolio in balance, stay
diversified while looking for the best possible value and in some cases use cash to control risk.
Staying in balance
A lesson from the world’s wealthiest families and most sophisticated investors is the importance of not just
starting with a diversified portfolio but maintaining that diversification as markets rise and fall. As a result of
the strong performance by stocks over the last number of years, unless funds have been reallocated along the way,
portfolios that had the right balance three years ago are out of balance today with an overweighting to equities.
That overweight can lead to greater downside risk than was built into the original portfolio.
Diversification
One of the best ways to control portfolio risk is through disciplined diversification. Diversification doesn’t
just mean holding stocks and bonds; it also entails ensuring that there is broad exposure across industry sectors.
Investors who were overexposed to the energy sector saw last year’s collapse in oil prices from over $100 to
under $50 hit their portfolios particularly hard. And on the topic of global diversification, the drop in oil
prices, if sustained for the period ahead, is particular positive news for large oil importers in Europe and Asia.
On that topic, long-time investor Stanley Druckenmiller is another respected voice whose views I follow. In a March
interview on CNBC, he described the comparative value available in
stocks such as Unilever, L’Oreal, BMW and Volkswagen relative to valuations on U.S. stocks.
Diversification also means not falling in love with stocks such as Apple. This article
points out that 30 years ago IBM had a role among U.S. stocks that was even more dominant that Apple’s today.
Investors who loaded up on IBM then would look back on that decision with regret today.
Controlling risk
We design portfolios with the view of providing clients with the best possible returns on a risk-adjusted basis when
looking across a full-market cycle. To do that, we look at the broadest possible range of alternatives, both within
the U.S. and around the world. For clients with a particular aversion to risk who cannot accept returns below the
long-term averages, we have recently increased cash to the high end of their target allocation. In doing so, we
emphasize that markets can stay expensive for many years and that expensive markets can become more expensive.
Holding cash should be viewed as similar to buying fire insurance on your house – it’s a waste of money
until you need it and then you’re very glad that you have it.
Ultimately, every client’s needs are unique, and we work hard to customize the portfolio that is right for
your personal risk tolerance and situation. If we haven’t talked recently, we would welcome the opportunity to
sit down to update your circumstances and to ensure that your portfolio is designed to provide the returns to
achieve your long-term goals with no more risk than is necessary.
I hope that you have found this review helpful. Please don’t hesitate to give me a call or send me an email if
you have any questions. And as always, thank you for the opportunity to serve as your financial advisor.
Name of Advisor
P.S. On a final note, the chart below shows stock returns over the past decade. As you can see, investors in U.S.
stocks have done especially well over the past five years as equities bounced back from the declines of 2008.
Although over 10 years, leaving currency out of the equation, an investor who was globally diversified did
significantly better than someone who just invested at home.
Annualized Returns in
Local Currency |
U.S. |
Europe |
Emerging
Markets |
World
Markets |
| 1 year |
5.5% |
7.6% |
6.3% |
8.7% |
| 3 years |
15.1% |
15.8% |
9.3% |
16.6% |
| 5 years |
15.1% |
11.0% |
7.4% |
13.5% |
| 10 years |
5.8% |
6.1% |
9.5% |
7.1% |
| Source: MSCI to June 30, 2015, total returns including dividends |
Dan Richards conducts programs to help advisors gain and retain
clients and is an award winning faculty member in the MBA program at the University of Toronto. To see more of his
written commentaries, go to www.danrichards.com.
Read more articles by Dan Richards
 Since 2008, I have posted a template for a client letter each quarter as a starting point for advisors who want to
send clients an overview of the period that just ended and some thoughts looking forward.
Since 2008, I have posted a template for a client letter each quarter as a starting point for advisors who want to
send clients an overview of the period that just ended and some thoughts looking forward.