Advisor Perspectives welcomes guest contributions. The views presented here do not necessarily represent those of Advisor Perspectives.

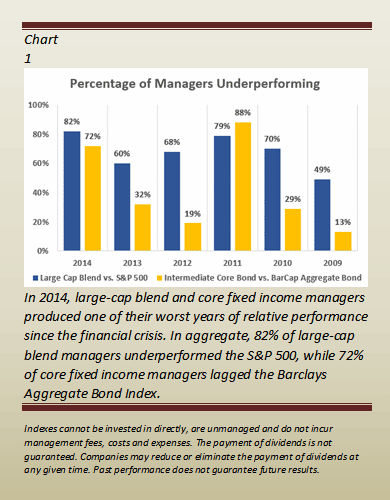
Last year was a particularly difficult period for active mutual fund managers. In particular, two of the broadest categories within the industry – U.S. large-cap blend and intermediate-term fixed income (i.e. core fixed income) – saw the majority of managers underperforming their benchmarks.
In the case of the large-cap blend universe, 82% of managers underperformed the S&P 500 index. Similarly 72% of core fixed income managers lagged the Barclays Aggregate Bond Index. Late last year we addressed this in a research note1 to our clients, offering a number of potential explanations. In a recent white paper, our colleagues at GMO very appropriately asked, “Is Skill Dead?” In this paper they examined the results of the large-cap blend peer group, and offered an optimistic outlook for active managers despite recent underperformance. In this article, I expand upon their work and our own by discussing how managers “cheat” for alpha by taking positions in out-of-benchmark risk premia and beta exposures, and how those bets have compromised recent results.
Return expectations for active managers
Before addressing the aforementioned risk premia and betas, it is worth discussing my expectations for the average active manager. As Fama and French stated in “Luck versus Skill in the Cross Section of Mutual Fund Returns,” investing is a zero-sum game gross of fees and a negative-sum game net of fees. Put more simply, for every investor (or in this case for every mutual fund) that produces a positive excess return there is another that produces a negative excess return, netting the average level of excess performance to zero (i.e., total average returns should be equal to the index return). However, when I factor fees into the equation, the average manager is no longer expected to perform in line with the index; rather, they are expected to produce the index return minus fees.
Why then are we surprised that the average large-cap blend and core fixed income managers underperformed last year?
We are not. Instead we are concerned by the degree of that underperformance and, more importantly, by the general lack of understanding of that underperformance by many investors.
Beginning with the large-cap blend universe, the average manager underperformed the S&P 500 by 275 basis points in 2014 (10.94% vs. 13.69%). In theory, this level of underperformance should have been approximately 97 basis points, the index return minus the average manager’s expense ratio, which equates to a return of 12.72%. Within the fixed-income category I found similar results, although not as extreme, where the average active manager underperformed the Barclays Aggregate Bond Index by 83 basis points (5.14% vs. 5.97%). This contrasted with an expectation of 5.27%, given an average expense ratio of 70 basis points.
While this may sound like a minuscule difference compared to what managers experienced on the equity side of the market, the return differentials between top and bottom performing managers varied widely across categories. For example, in 2014 the performance spread between large-blend managers in the top and bottom 5% of their peer group was more than 11%, compared to less than 5% for the intermediate-term bond category.
So, if logic and economic theory cannot explain the outsized underperformance of active managers last year or the outsized excess returns of the past, there must be an additional factor or factors driving results. Managers must be holding something in their portfolios that is inherently different or absent from their benchmark or some other market participant must be profiting from their lack of skill. To test this hypothesis, I examined two of Morningstar’s largest mutual fund categories, beginning with U.S. large-cap blend.
U.S. large-cap blend
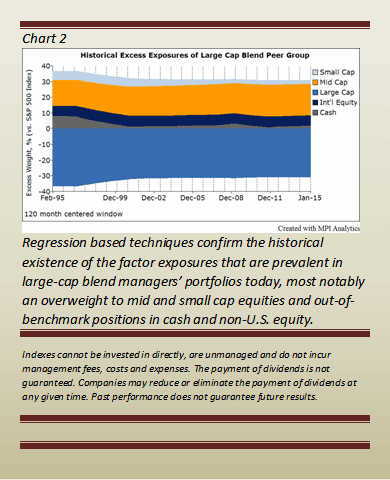
The Morningstar large-cap blend peer group is comprised of 903 distinct funds. Using the most recently reported holdings data, I found three primary differences between the average manager’s portfolio and the S&P 500 index. The most notable is their position in mid- and small-cap equities, which in total account for 12.50% of the index, but over 22% of the average large-cap manager’s portfolio. In addition, the aggregate peer group maintains nearly a 6% position in non-US equities vs. only 1% in the index, as well as a 5% allocation to cash, which is not held in the S&P 500.
These biases are not new. With the use of regression-based techniques we can overcome the limited availability of holdings data to prove that these biases have existed for at least the last 20 years. As Chart 2 illustrates, the peer group has maintained a relatively stable weight of approximately 6% in non-U.S. equities over the entire period, while mid-cap exposure has risen from approximately 16% to 20%, and small-cap exposure declined from approximately 5.5% to 2.5%. Cash was slightly more volatile, spiking around periods of market stress (e.g., 2008) and settling closer to 2% more recently. Though there may be other less influential factors I excluded from this study– such as fixed income or style – I am confident in its statistical reliability, as it produces a near 96% adjusted r-squared over the analysis period of 2/1/1995 to 12/31/2014.
Now that I have identified a number of biases and confirmed their long-term persistence, it is worth understanding why they exist. The answer is simple: performance – and more specifically excess performance – versus the S&P 500 index. With the exception of cash, each of these biases are a risk premium, defined broadly as an asset that is expected to produce higher returns over the long term in order to compensate investors for assuming additional risk.
By taking an out-of-benchmark position in a risk premium, a manager can seemingly improve their “alpha” by adding nothing more than permanent risk-enhancing beta. While risk premia typically outperform over extremely long periods of time, as academics have shown with extensive research on the value and small-cap premia, this is not necessarily true over shorter windows. In fact, these premia have been quite time-period dependent, vacillating in and out of favor. This has happened regularly and can be seen in the underperformance of the value premium during the 1990s. This has also occurred more recently, from 2008 to 2014, when the Russell 1000 value index lagged its growth counterpart by 196 basis points annually with an annualized standard deviation that was nearly 100 basis points higher.
Examining the past 10 years, it becomes clear why managers have been attracted to these risk premia, mid-caps, small-caps, and non-U.S. equities in particular. From January 2005 through June 2011, mid-caps outperformed large caps by 3.94% annually, small caps outperformed by 2.29%, and international equities led by 2.37%. As a result, a position in any of these asset classes would have been greatly accretive to the excess performance of a large-cap blend mutual fund. Empirically, we see this in the peer group statistics, as the S&P 500 outperformed just 56% of large-cap blend managers over that same time period versus a long-term average that was closer to 65%. Fast forward to the period of July 2011 through year-end 2104 and we saw a significantly different picture, as the relative performance of all three asset classes reversed course. Mid-caps lagged by an annualized 1.03%, small caps trailed by more than 3.00%, and non-US equities produced an annualized excess return of -11.59%. As would be expected, this had a nearly opposite impact on the relative results of the large-cap blend universe, as the index outperformed more than 80% of active funds over the entire period.
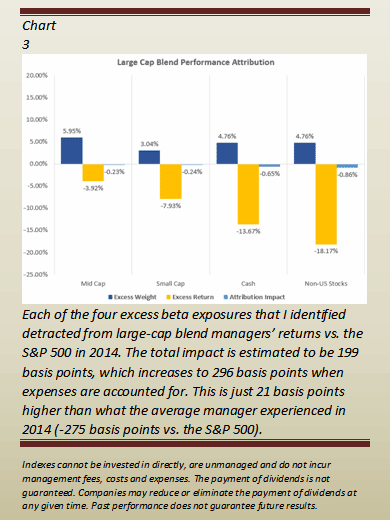
It is relatively clear why the average manager underperformed by such a wide margin in 2014. However, let us do the math to better understand the direct impact of each decision on relative performance. To begin, the universe of large-cap blend managers maintained aggregate-level active positions versus the S&P 500 of roughly +6% in mid-cap, +3% in small caps, and +5% in both non-US equities and cash. While the S&P 500 returned 13.69% in 2014, mid cap retuned 9.77% (-3.92% vs. the index), small caps returned 5.76% (-7.93% vs. the index), cash was flat, and international equities lost 4.48% (-18.17% vs. the index).
Taking the combined effect of each exposure’s weight along with its relative performance, we can attribute a negative 199 basis points of the average manager’s excess return to these factor exposures. Couple this with an average net expense ratio of 97 basis points and we would predict the average large-cap blend manager to have trailed the S&P 500 by 2.96% in 2014. In reality the average manager trailed by 2.75%, meaning that our bottoms-up estimate was off by just 21 basis points, likely the result of some small overlooked exposure or positive security selection. Either way, it is clear that the underperformance in 2014 was not necessarily indicative of a lack of skill, but rather the result of the peer group, in aggregate, investing in multiple risk premia (i.e., “cheating”) that were out of favor at precisely the same time.
U.S. core fixed income
Unlike traditional equity managers, actively managed fixed income funds are more difficult to analyze, given the number of levers that managers can pull in an effort to deliver excess returns. In particular, managers can vary duration, curve positioning, sector allocation, as well as credit quality in an effort to outpace their benchmark. Though there has been some variation from the Barclays Aggregate Bond index in terms of the first three factors, I will focus on the latter and most impactful factor as of late: credit quality.
Examining recent holdings data for the Morningstar intermediate-term bond (i.e., core bond) peer group, which contained 510 unique funds, I found an approximate allocation of 8.5% to high-yield bonds. This includes all issues rated below BBB or classified as not rated. To analyze this exposure historically, I used the same regression-based techniques that I utilized for the large-cap blend universe. By applying this method I observed a current position of roughly 10% allocated to high-yield bonds, which is relatively in line with what I found in the holdings data.
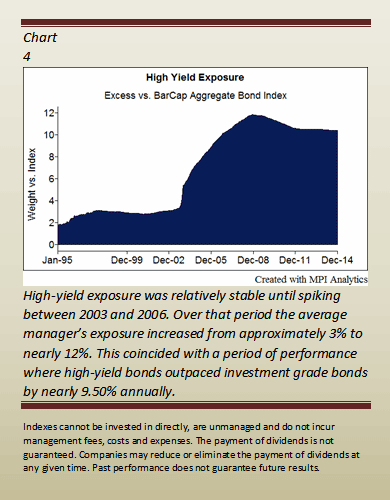
However, what is more interesting is the change in this positioning over time and the relative speed at which it occurred (See Chart 4). Looking at the pre-2005 period, the average manager weighting was less than 3% in high-yield. In the matter of just a few years this number increased four-fold to a peak of roughly 12% in 2008. What explained the spike in ownership over the last 10 years? The answer comes directly from my discussion of the large-cap blend peer group; managers allocated to strong performing out-of-benchmark risk premia.
Not surprisingly, over the same period where managers drastically increased their allocation to high-yield bonds, 2003 through 2006, the asset class outperformed the Barclays Aggregate index by nearly 9.50% on an annualized basis. In the relatively low-return universe of fixed income, an out-of-benchmark position in high-yield was additive to a manager’s relative performance, particularly one that is benchmarked to a purely investment-grade index. The average core fixed income manager outperformed the index by 18 basis points over that period. Fast forward past the financial crisis and we see even more striking results. From January 2009 through December 2013, high-yield outperformed investment-grade bonds by 12.50% annually (18.93% vs. 4.44%). This helped the average manager to outperform the Barclays Aggregate Index by nearly 200 basis points annually over the period, translating into an 82nd percentile peer ranking for the index.
As is inevitably the case, mean reversion occurred in 2014 and high-yield bond spreads reverted, causing a large percentage of the core fixed income peer group to suffer from a whipsaw effect. To quantify, coupling an average allocation of 8.50% to high-yield bonds and the asset class’ underperformance of 350 basis points during 2014 (2.45% vs. 5.97%), would lead to an estimated negative impact of 30 basis points vs. the Barclays Aggregate index. Combining this with an average fee level of 70 basis points, the average manager would be expected to have underperformed by 100 basis points. In actuality, the average manager underperformed by 0.83% in 2014, with the small difference likely being the result of a positive effect from duration positioning, curve positioning, or positive issue selection.
Conclusion
While 2014 was a difficult market for the majority of mutual fund managers, especially those within the large-cap and core fixed income space, it did not signify the death of active management. It should instead serve as a wakeup call for investors to gain a better understanding of their underlying portfolio holdings. Overall, managers did not underperform in 2014 due to a systemic failure in their ability; they trailed due to an industry-wide overweight to multiple risk premia that were out of favor all at the same time.
Alpha is risk-adjusted excess return after identifying all possible beta exposures. If one happens to overlook a beta driver like those discussed in this article, it has the potential to lead to disastrous consequences, including underperformance, as well as poor hire and fire decisions of the mangers within your portfolio.
Ryan J. Lehman, CFA, CAIA, is the director of investments for Integrated Capital Management, an outsourced investment department based in Pennsylvania that provides model portfolio solutions to advisors and their clients.
Read more articles by Ryan J. Lehman

 Examining the past 10 years, it becomes clear why managers have been attracted to these risk premia, mid-caps, small-caps, and non-U.S. equities in particular. From January 2005 through June 2011, mid-caps outperformed large caps by 3.94% annually, small caps outperformed by 2.29%, and international equities led by 2.37%. As a result, a position in any of these asset classes would have been greatly accretive to the excess performance of a large-cap blend mutual fund. Empirically, we see this in the peer group statistics, as the S&P 500 outperformed just 56% of large-cap blend managers over that same time period versus a long-term average that was closer to 65%. Fast forward to the period of July 2011 through year-end 2104 and we saw a significantly different picture, as the relative performance of all three asset classes reversed course. Mid-caps lagged by an annualized 1.03%, small caps trailed by more than 3.00%, and non-US equities produced an annualized excess return of -11.59%. As would be expected, this had a nearly opposite impact on the relative results of the large-cap blend universe, as the index outperformed more than 80% of active funds over the entire period.