Sustainable-spending rates for retirement depend on many factors: asset- and product-allocation, market valuations at the start of retirement (particularly, current interest rates), the desired spending pattern over retirement, the degree of flexibility to adjust spending in response to market performance and the length of the client’s planning horizon.
Last week, my article introduced the Retirement Accumulation and Retirement Affordability indices, which help clients determine if they are retiring at a good time. In this article, I will present my new Retirement Dashboard. More specifically, I will explain the section of the dashboard on “The Cost of Retiring Today – Sustainable Spending Rates for Retirement,” with these factors in mind.
This analysis is conducted for a couple who both turn 65 on January 1, 2015. I estimated the sustainable-spending rates for two very different types of retirement-income strategies: those based on dedicated-income sources that can match client spending needs without exposing the client to market volatility, and those based on investment portfolios in which market volatility will play a much larger role in determining retirement sustainability.
Sustainable spending from dedicated-income sources
This section of the dashboard provides an overview of the situation today for funding retirement with dedicated-income sources, using different combinations of income annuities and individual bonds. For a 65-year-old couple, I consider three different retirement-income strategies for three different types of retirement spending goals, producing the nine numbers shown in Table 1.
Table 1
Sustainable Spending from Dedicated-Income Sources
Spending Rates Obtainable for 65-Year Old Couple, January 2015
|
Income Growth Factor |
SPIA |
30-Year
Bond Ladder |
20-Year
Bond Ladder
+ DIA @ 85 |
|
Fixed (No Growth) |
5.59% |
4.51% |
4.94% |
2% COLA |
4.40% |
3.48% |
3.95% |
CPI-U Adjusted |
3.75% |
3.65% |
4.03% |
|
The three strategies shown in the table for a 65-year old couple are:
Buy a joint and 100% survivor’s life-only single-premium immediate annuity (SPIA).
Buy a ladder of bonds maturing over the next 30 years.
Buy a ladder of bonds maturing over the next 20 years and purchase a deferred-income annuity (DIA), which will continue the same income level and trend in years 21 and beyond
SPIA & DIA rates are based on the average of the top three quotes from Cannex (except for CPI-U products, since there are only two carriers at present) for life-only benefits using $100,000 of non-qualified funds for a joint and 100% survivor’s annuity. Bond ladders for fixed and 2% growth spending are based on Treasury strips, while TIPS are used for CPI-U adjusted spending, using wholesale prices from the Wall Street Journal, and assuming a 1.5% mark-up in price for retail investors. For the CPI-U adjusted DIA, a 1.8% inflation rate is assumed to calibrate initial income in 20 years. This is the current breakeven inflation rate predicted over 20 years by the yield differences between TIPS and nominal Treasury bonds.
The SPIA strategy is able to support income much closer to the couple’s actual remaining life expectancy based on an underlying portfolio consisting mostly of fixed income. Unlike the traditional 4% rule, this strategy adjusts for current interest rates, which along with increasing longevity explain why SPIA rates are lower today than they have been in the past. The assets used to purchase a SPIA are illiquid, and there would be no further upside potential. The advantage is that the SPIA eliminates market and longevity risk for the client (other than the credit risk of the issuing insurance company).
If the client does not seek any growth in spending over retirement, the SPIA strategy can support an initial payout rate of 5.59%, meaning that a $100,000 premium will support $5,590 of income per year (paid monthly) for as long as at least one spouse remains alive. With an automatic annual 2% increase in spending power, the payout rate is 4.4% of initial assets. It is less initially, but spending will grow throughout retirement. Finally, if the client seeks inflation-protection by having the SPIA adjust for changes in the consumer price index (specifically, the CPI-U), the initial payout rate is 3.75%. Long-term market expectations for inflation are currently low (less than 2%) as implied by the Treasury and TIPS markets. This makes the CPI-adjusted SPIA particularly expensive at the present, perhaps because of the lack of competition in this market and the difficulties of hedging long-term inflation beyond 30 years. However, if realized inflation is higher than expected, clients will be thankful for adding this rider.
The next strategy is to build a 30-year ladder of bonds. For the cases of no spending growth and 2% spending growth, I use Treasury strips data. For CPI-U-adjusted spending, I use TIPS. These calculations require data for the entire yield curve with bonds maturing in each year over the subsequent 30-year time horizon. To calculate sustainable spending with a bond ladder requires determining how much it will cost to purchase bonds providing the desired spending pattern, and then calculating the initial payout rate implied by this cost. I provide a full explanation for calculating the cost of a TIPS ladder on my blog. The current payout rates from a bond ladder are 4.51% with no spending growth, 3.48% with 2% spending growth and 3.65% for CPI-adjusted spending growth. Comparing these rates with the SPIA rates, income annuities are relatively attractive when not using CPI adjustments, but the spread is much closer with CPI adjustments.
The payout rate (and the implied internal rate of return on the underlying TIPS) for the 30-year TIPS ladder is almost identical to the much more simplified calculation used to determine sustainable spending with my previously described Retirement Affordability IndexTM. Practically speaking, despite being a simpler calculation, the Retirement Affordability IndexTM can be thought of as using a 30-year TIPS ladder to support retirement spending.
The final strategy in the table is to combine a 20-year bond ladder with a DIA. This strategy was developed by Professor S. Gowri Shankar at the University of Washington, and subsequently popularized in an article by Steven Sexauer and co-authors. It is the basis for the Allianz DCDB Benchmark. Their benchmark is slightly different than what I present here because they combined a 20-year TIPS ladder with a no-growth DIA, whereas I try to maintain consistency between income growth in the ladder and the DIA.
With no spending growth, the payout from this strategy is 4.94%. This strategy would support precisely the same spending stream as the SPIA offering a 5.59% payout. The difference in the payout rates can be attributed to the liquidity and the ability to bequest any assets from the 20-year bond ladder in the unfortunate case that the retiree does not live at least 20 years.
Relative to a simple 30-year bond ladder, this hybrid strategy is quite attractive. By giving up liquidity for a small portion of assets (it would require 16% of assets to purchase the DIA, with the other 84% of assets used for the 20-year bond ladder), the client could sustain almost 10% more income (the difference between 4.94% and 4.51% payouts) than could be sustained with the bond ladder. The client would also have a contractual guarantee that this income would continue beyond year 30. The trouble with a 30-year bond ladder is the lack of provisions for income in year 31.The client may have a concern about the credit risk for the DIA issuer but would have to weigh this concern against the higher income and longevity protection from the hybrid approach.
As for the CPI-adjusted case, the hybrid bonds/DIA strategy can support a higher payout than either annuities or bonds alone. This is partly because of the low payout currently offered for the CPI-adjusted SPIA. Also, it is impossible to avoid some inflation risk with the hybrid strategy. Currently, there is no DIA that provides inflation protection for the initial payout made in the future. CPI-adjusted DIAs only provide inflation protection for spending after the initial amount. This requires an assumption about inflation until the DIA payments begin. In this case I used the 1.8% breakeven inflation rate implied by the bond market to calculate the amount of DIA to purchase. To the extent that inflation differs from this expectation over the next 20 years, there will be a significant jolt to the real spending power provided by the strategy in year 21 of retirement.
Sustainable spending from volatile investment portfolios
The next set of strategies includes specific allowances for portfolio depletion because they are based on volatile investment asset classes (stock and bond funds). Before continuing this discussion, let’s recognize and understand why sustainable spending rates for these strategies can be less than with dedicated income. For example, the conservative sustainable withdrawal rate with inflation-adjusted income is reported in Table 2 as 2.35%. I frequently hear people question how this could possibly be since a 30-year TIPS ladder supports 3.65%. The answer is risk: both market and sequence-of-returns risks. Sustaining an income stream from a volatile portfolio is a complicated task that creates a great deal of downside risk as well as upside potential. A 2.35% withdrawal rate might create a 5% chance for failure, but a client could end up fine using an 8% withdrawal rate. We cannot know in advance what the specific sequence of returns will be, so sustainable withdrawal rates must inherently be conservative to allow the spending rate to work in the vast majority of cases. While there is additional upside potential with these strategies, initial projected spending rates can be less than with dedicated income. Early market declines in retirement will create a hole from which recovery may not possible.
Table 2
Sustainable Spending from Volatile Investment Portfolios
Sustainable Spending Rates from an Investment Portfolio over 30 years, January 2015
|
Spending Strategy |
Conservative |
Moderate |
Aggressive |
|
Fixed Spending (No Growth) |
4.09% |
4.44%
|
5.19% |
Spending with 2% COLA |
3.13% |
3.44% |
4.09% |
Inflation (CPI-U) Adjusted Spending (i.e. “the 4% rule”) |
2.35% |
2.88% |
3.51% |
Guyton and Klinger's Decision Rules |
4.77% |
5.31% |
6.03% |
David Zolt's Target Percentage Adjustment: No CPI Increase |
3.23% |
3.88% |
4.75% |
|
Table 2 reports sustainable-spending rates for conservative, moderate and aggressive clients, using five different retirement spending strategies. The conservative couple uses a 25% stock allocation and seeks a 95% chance that the portfolio will not be depleted within 30 years. The moderate couple uses a 50% stock allocation and seeks a 90% chance that the portfolio will not be depleted within 30 years. The aggressive couple uses a 75% stock allocation and seeks an 80% chance that the portfolio will not be depleted within 30 years.
Aggressive behavior means investing and spending more aggressively. Aggressive spending is realized through greater allowance for failure (i.e. portfolio depletion). The analysis assumes that withdrawals are made at the start of each year, a 0.5% portfolio administrative fee is deducted at the end of each year and market return simulations are based on capital market assumptions described in the appendix.
The first three spending strategies are the same as those found in the discussion for dedicated income: constant spending, spending that grows by 2% and spending that adjusts for inflation (CPI-U). Naturally, aggressive clients can comfortably spend more than conservative clients, but they are implicitly accepting a greater chance that their spending will have to deviate from the strategy for the worse. Nonetheless, even the aggressive client cannot expect to use as high an initial spending rate as with SPIA. Keeping liquidity and upside potential (a chance to either raise future spending or to leave a larger legacy) is wonderful, but the “cost” of maintaining these options is to start retirement with a lower spending rate than with dedicated income. Of course, advisors and clients should evaluate the advantages and disadvantages when deciding which strategy to use. Moderate clients could expect to spend a little less initially than what could be supported with the 30-year bond ladder with Treasury strips, and a lot less when CPI-adjusted spending is desired. Aggressive clients could start retirement by spending a little more (except in the CPI adjusted case) than the hybrid bond/DIA strategies. Conservative clients ultimately must question whether volatile portfolios will be appropriate for their situations and preferences, as their initial spending could be substantially higher using dedicated income strategies.
The 4% rule worked historically. Clients could have withdrawn 4% of their retirement date assets and sustained this inflation-adjusted amount over 30 years – assuming they did not pay any investment management fees. However, it is not clear if the strategy can be expected to work when retiring at a time with such low interest rates. Even an aggressive retiree should consider beginning their retirement with a spending rate less than 4% when seeking inflation-adjusted spending. This issue was discussed in a previous article, which I co-authored with Michael Finke and David Blanchett.
The two remaining strategies in the table are for clients willing to make spending adjustments in response to market returns. In reality, all clients will use some sort of variable spending strategy. No one would continue the prescribed inflation-adjusted spending as their portfolio plummeted toward zero. In addition, as Dirk Cotton of the Retirement Café blog formalized, constant spending from a volatile portfolio is a unique cause of sequence risk. This is a risk that cannot be diversified away. If a client wishes to use a volatile portfolio, adjusting spending in response to market returns can create disproportionate improvements to spending rates because sequence-of-returns risk is mitigated when a client withdraws less from a declining portfolio.
There are countless ways for advisors to create strategies that respond to market returns. Some approaches would not have any failure, such as spending a fixed percentage of the remaining portfolio each year or guiding spending with the IRS RMD rules. But spending could still fall to painfully low levels. Without a technical failure being possible, those strategies cannot be simulated in the context of this table. But two of the more prominent variable spending strategies that can lead to portfolio depletion are Jonathan Guyton and William Klinger's Decision Rules and David Zolt's Target Percentage Adjustment.
To replicate the Guyton and Klinger Decision Rules, I did the following. Each year, spending adjusts for inflation unless the portfolio had a negative return in the previous year and this year's withdrawal rate (current spending divided by remaining assets) is higher than the initial withdrawal rate at the retirement date. The “prosperity rule” increases spending by 10% in any year that the current withdrawal rate falls to be 20% less than its initial level. The “capital preservation rule” cuts spending by 10% during the first 15 years of retirement if the current withdrawal rate rises to be 20% more than its initial level. With the decision rules, spending can increase faster than inflation when the markets are doing well, and can fall even in nominal terms when the portfolio is losing value.
David Zolt’s Target Percentage Adjustment calls for more moderate spending adjustments. Given a fixed-return assumption and a 45-year time horizon, he calculates how much wealth should remain for each year of retirement. In any year that remaining wealth is higher than critical number from his calculation, spending adjusts for inflation. However in any year that wealth falls below where it should be as implied by this critical path, no inflation-adjustment is made. Throughout retirement, sometimes spending adjusts for inflation and sometimes it stays fixed.
Table 2 shows that spending can begin at a dramatically higher level using the Guyton and Klinger Decision Rules. Intuitively, providing a framework to adjust spending downward when markets are not doing well can support starting retirement at a higher initial spending level. With my capital market expectations, a conservative client can start with a 4.77% withdrawal rate, and presently the 6% barrier can be broached for an aggressive client. That is the highest spending rate found in either table. Meanwhile, though the initial withdrawal rates do not increase by as much, David Zolt's strategy is also particularly helpful for increasing the initial spending rate beyond some alternatives, which set the entire future path of spending in advance. While the spending rate is not as high as with fixed spending, spending rates are higher than the inflation-adjusted or 2% spending growth strategies.
The bottom line
Sustainable spending is related to current market conditions. There are also a wide variety of approaches to consider with regard to spending patterns over retirement, flexibility to adjust spending and investment choices. For these reasons, my Retirement Dashboard will provide frequent updates about sustainable spending for retirees with a wide variety of spending strategies. My hope is that this will help advisors and clients with the decision making process.
Wade D. Pfau, Ph.D., CFA, is a professor of retirement income in the Ph.D. program in financial services and retirement planning at the American College in Bryn Mawr, PA. He is also the director of retirement research for McLean Asset Management and inStream Solutions. He maintains the Retirement Researcher website. See his Google+ profile for more information.
Appendix
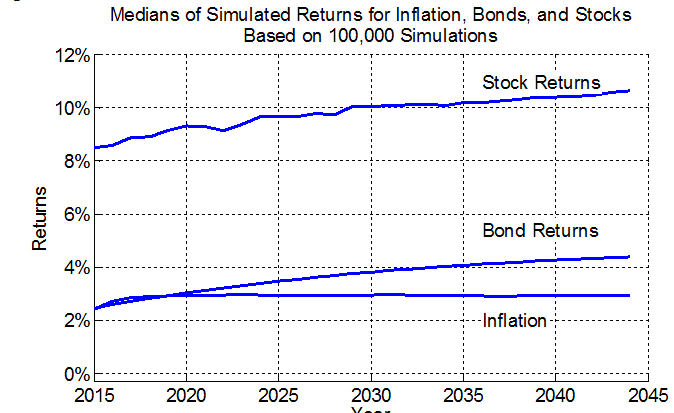
My market expectations connect the historical averages from Robert Shiller's dataset with the current values for inflation and interest rates. This makes allowances for the fact that interest rates and inflation are currently far from their historical averages (which is particularly important for retirees because of sequence risk - early returns matter disproportionately), but it also respects historical averages and does not force returns to remain low for the entire retirement period. Figure A1 shows the median simulated outcomes for this approach.
Figure A1

Read more articles by Wade Pfau