Advisor Perspectives welcomes guest contributions. The views presented here do not necessarily represent those of Advisor Perspectives.
“The risk of paying too high a price for good quality stocks – while a real one – is not the chief hazard confronting the average buyer of securities. Observation over many years has taught us that the chief losses to investors come from the purchase of low quality securities at times of favorable business conditions.” – Benjamin Graham
"It's far better to buy a wonderful company at a fair price than a fair company at a wonderful price." – Warren E. Buffett
As the above quotes illustrate, quality-driven investing has been around for quite some time. However, it has gained renewed momentum over the past decade driven by the spectacular crashes experienced after the technology boom and during the global financial crisis.
Academic research has also revealed the benefits of quality-driven investing. Over the last few years, several academics have weighed in on the quality factor and many papers have been written trying to identify criteria to define it. Further, quality is becoming widely accepted as an anomaly and is now being designated by many researchers as a fifth factor explaining investment returns along with the four widely accepted factors: beta, size, momentum, and value. This development is in sync with our long-held belief that quality is a distinct investment style.
This article builds on a number of studies that have explored returns to factors such as profitability, the relationship between accounting, and economic profits and leverage. Robert Novy-Marx (2013) showed that stocks with high gross profitability as measured by gross profits to assets outperform. Chan, et al. (2006) showed that the difference between accounting earnings and cash flows are negatively associated with future returns. George and Hwang (2010) showed that stocks with low leverage have high alpha.
We will discuss the investment returns from a simple quantitative process of selecting high-quality businesses. In valuing such businesses, market participants systematically underestimate the duration of competitive advantage. Because of this, the valuation premium assigned does not sufficiently account for the difference between the business value creation potential of a high-quality business as compared to the average business. Indeed, a basket of high-quality stocks generates significantly superior investment returns compared to publicly traded benchmarks, and it does so with significantly lower risk.
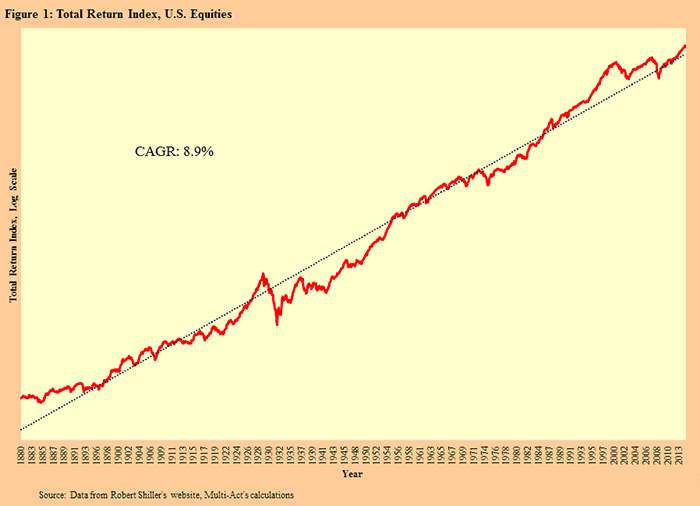
Long-term returns1 of U.S. equities
Over the last 130 years, U.S. equities2 have generated a total return of 8.9% annually including dividends3. While there has been significant variation in year-over-year returns, the long-term picture is that of a consistent compounding of wealth as seen in Figure 1.
Figure 1

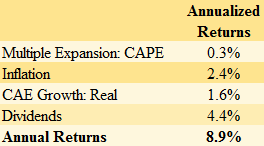
Components of investment returns
The total investment return from equities can be decomposed in four components: dividends4, inflation, real growth in business value, and change in Mr. Market’s5 “perception” of the value of those businesses. Equation 1 below formulates the decomposition of total investment returns among those four components.
Equation 1
Total Return from Equities6 = Dividend Yield + Inflation + Real Gr in Business Value + ∆ Valuation ascribed to Businesses
While dividend yield and inflation are straightforward numbers, we need some proxies for growth in business value and changes in valuations ascribed by market participants to businesses. For the purpose of our analysis, we have used growth in cyclically adjusted earnings7 as the proxy for business value growth and changes in cyclically adjusted price-to-earnings ratio (CAPE) as the proxy for changes in valuation ascribed to businesses by market participants. Table 1 shows the contribution to total returns from U.S. equities from these four factors over the last 130 years. Clearly, dividends have been the largest component of the total investment returns.
Table 1 – Components of U.S. equity returns
Modified equation for approximating total returns
While changes in business valuations are an important driver of returns over short and intermediate terms, their impact on total investment return over very long periods should be insignificant. This is because interest rates and growth expectations--the two primary drivers of the multiples assigned by market participants to cash flows or assets of businesses--revert to the mean in the long term.
We contend that changes in business valuations over very long periods of time should be a tiny component of total returns. Table 1, supporting this, shows that changes in valuation ascribed to businesses, using changes in CAPE multiple as a proxy, were a very small contributor to total investment returns at 0.3%.
With this insight in mind, the equation to approximate total return from equities can be rewritten as follows:
Equation 2
Long-Term Total Return from Equities ≈ Dividend Yield + Inflation + Real Gr in Business Value
Further, inflation plus real growth in business value approximates the nominal growth in the business value and so the equation above can be further modified as below:
Equation 3
Long-Term Total Return from Equities ≈ Dividend Yield + Nominal Gr (Business Value)
Stock-price appreciation and business-value growth
Given that the total return from equities are equal to the sum of dividend and stock price appreciation, Equation 3 makes it clear that over very long periods, the capital gains component of return from investing in equities is largely attributable to underlying business-value growth. Using the data from Table 1, capital appreciation contributed about 4.0% to total return from equities (Inflation + CAE Growth: Real)8. From the discussion above, we deduce that the underlying business-value growth of companies included in the S&P 500 was approximately 4.0% annually over this period.
This assertion-- that over long periods of time, price returns earned from investing in equities approximately equal the underlying business value growth--is also supported by data published by the Federal Reserve. Based on its Flow of Funds report9, the net worth of nonfinancial corporate businesses in the U.S. grew at a CAGR of 7.1% between 1945 and 2014. Since net worth of all businesses is a good proxy for underlying business-value growth, this tells us that the business value of nonfinancial corporate businesses in the U.S. grew at about 7.1% over that time. Over this same period, S&P 500’s price increased at a CAGR of 7.2%10!
We conclude this section with the assertion that the price appreciation component of the total return from equities is largely composed of growth in underlying business value.
A simple11 way to enhance investment returns over the long term
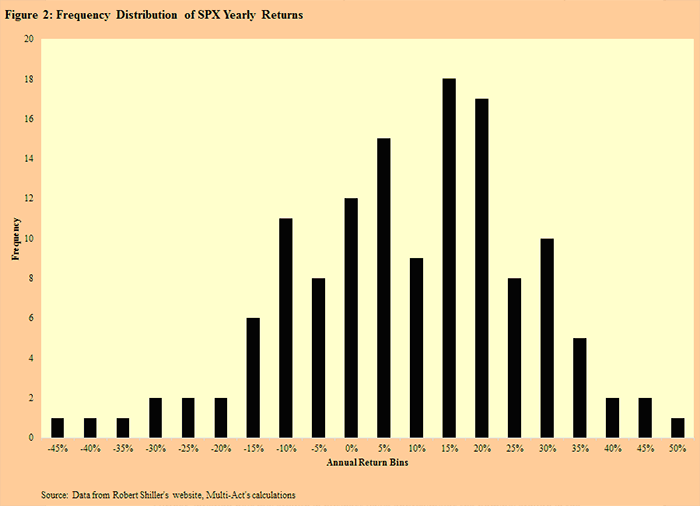
The 7.2% return referred to earlier is the geometric mean of the S&P 500 yearly returns between 1945 and 2014. This of course doesn’t mean that S&P 500 had a return of 7.2% in each of those years. Much like any average, it lumps together numbers that were well below and significantly above it.
Figure 2 shows the distribution of S&P 500’s yearly returns between 1880 and 2013. There were several observations in the negative territory. Similarly, the 7.2% price growth witnessed by the S&P 500 doesn’t mean that every business that was included in the index grew at that pace. While there were several businesses that managed to grow at significantly higher pace, there were several others that grew at much lower rates.
Figure 2
An investment process that successfully identifies businesses that are able to grow their underlying business values at above-average rates over long term should generate superior long-term investment returns. The key is to identify businesses that are to the far right of the underlying business-value growth distributions and have the ability to stay in that zone.
A business that is able to grow its enterprise value at rates well above the average is enjoying a competitive advantage at that point of time. However, the ability to stay in that zone depends on the sustainability of that competitive advantage.
A simple way to enhance investment returns of a portfolio over the long-term is to invest in businesses that have the ability to grow their business values at above-average rates in a sustainable manner. Such businesses possess significant competitive advantages that are sustainable. We refer to such companies as high-quality (HQ) businesses.
Investment returns to quality in developed markets
In the discussion that follows, we lay out the framework for selecting HQ businesses and the risk-return of a basket of HQ stocks.
-
Quality: Qualitative Factors
We have spent over 15 years developing and perfecting our process for identifying HQ businesses. Our internal research process assigns every company we follow a quality rating, referred to as a ‘grade.’ There are several components of our process, some of which lend themselves to quantitative modeling while others don’t. A crucial component of our classification of a business as HQ is the existence of “sustainable” competitive advantage, a component that does not lend itself to quantitative modeling.
The existence and sustainability of competitive advantage are the most important criteria in our classification of a business as HQ. This is driven by our assertion that much of the investment returns that accrue to investors from quality factors depend on the ability of the business to persist with its supernormal returns on capital. This in turn depends on its ability to keep competition at bay. Given our inability to model this component, we believe that our manually selected list of quality businesses will likely generate superior risk-adjusted performance as compared to the quantitatively selected basket discussed here.
-
Quality: Quantitative Factors
There are some key characteristics of an HQ business. An HQ business generates superior returns on capital – the stronger the competitive advantage, the lesser the impact of competition and the higher the returns on capital. Returns on capital of such businesses tend to be persistently high. Further, such businesses have a very healthy relationship between their accounting profits and their economic profits. Our HQ businesses possess good balance sheets, so financial risk isn't a significant factor driving our investment returns or desire to mitigate risk.
Exhibit 1: Determination of Quality Companies
Source: MAEG
As shown in Exhibit 1, our process includes three characteristics that lend them to quantitative analysis. Our research process utilizes a multiplicity of measures within each characteristic. However, for the sake of simplicity, we have chosen one measure to represent each quality characteristic.
For the purposes of this article, we measured returns on capital by return on equity (ROE). A high ROE indicates the existence of competitive advantage and the persistence of this variable suggests its sustainability.
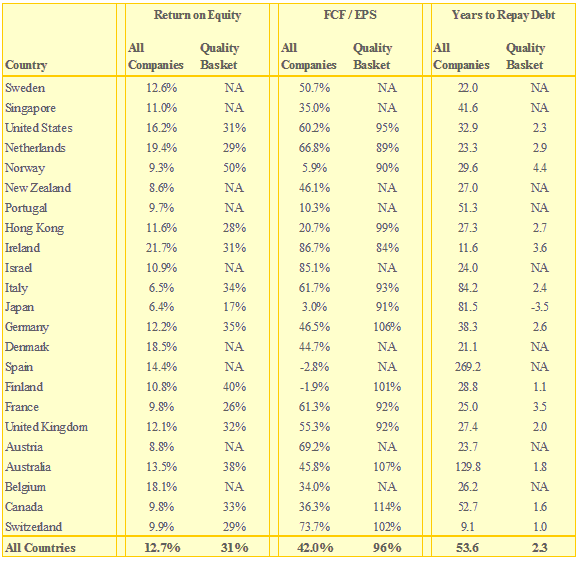
It is possible for the management of a company to manage its ROE. To the extent that earnings are manipulated, they will impact ROE. Further, ROE is affected by corporate transactions including buybacks, acquisitions, and restructurings. To ensure that the earnings component of the ROE is not a result of financial creativity, we use free cash flow over earnings (FCF/EPS) to calibrate the quality of earnings. We have found that this measure filters out companies with suspect accounting numbers. Finally, we measure financial safety by net debt over free cash flow (ND/FCF). This measure indicates the number of years of free cash flow needed to repay the debt. Table 2 provides summary statistics on each of the quality factors by country.
Table 2. Comparison of Quality Measures
This table shows average quality measures by country for the investment universe and for the quality basket. This table reports the average of each year’s equal-weighted average of quality measures between 1997 and 2014.
Data and quality factors
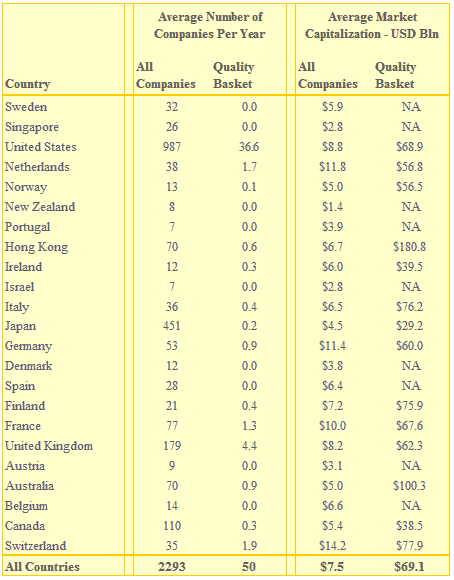
Our data sample consists of 5,262 companies covering 2312 countries between 1997 and 2013. The 23 markets correspond to countries contained in the MSCI World Developed Index as of December 31, 2013. All data, including fundamentals and prices, are from Factset Global Data Feed with returns calculated in USD with currency risk hedged away. We utilized fundamental data reported during calendar year t-1 in April of calendar year t such that there is a minimum three-month lag from the end of the fiscal year of the company. Table 3 provides summary statistics on number of companies and market capitalization by country.
Table 2. Number of Companies and Market Capitalization
This table shows the yearly average of total number of companies and the yearly average of average market capitalization for the investment universe, as well as for the quality basket, by country.
Since the cash flow data is available from 1989 and some of our fundamental variables require five-year data availability, our sample could start in 1994 at the earliest. However, given the limited number of companies satisfying our data requirements, our model starts in 1997.
-
Methodology
Before proceeding with our calculations, we performed exclusions for size and for suitability and data applicability. We excluded all companies with market capitalization less than USD 1 billion. This number was deflated at 6% annually for years prior to 2013. This exclusion is meant to minimize size factor’s contribution to our investment returns.
Additionally, we excluded some industries that in our assessment do not lend themselves to existence of sustainable competitive advantages13. This is not to say that there cannot be a business with sustainable competitive advantage in these industries. However, the probability of finding a business with sustainable competitive advantage in these industries is significantly lower. Further, calculating cash-flow data presents a practical problem with some of these industries, especially in the case of banking and insurance, where cash flow is affected by changes to loans, investments, and deposits and thus loses its sanctity. Accordingly, we have excluded these industries from our samples.
We calculated the quality factors discussed earlier for all of the remaining stocks in our data sample. We then applied absolute cutoffs that a business must meet in order to qualify as an HQ business. Businesses that meet these cutoffs were then sorted by their market capitalization in a descending order. Finally, we selected 50 of the largest businesses from all qualifying businesses as our quality basket.
This process resulted in a basket of 50 HQ stocks every year. We tested the performance of the baskets over a period of 17 years, from 1997 to 2013.
-
Risk and returns of the quality basket
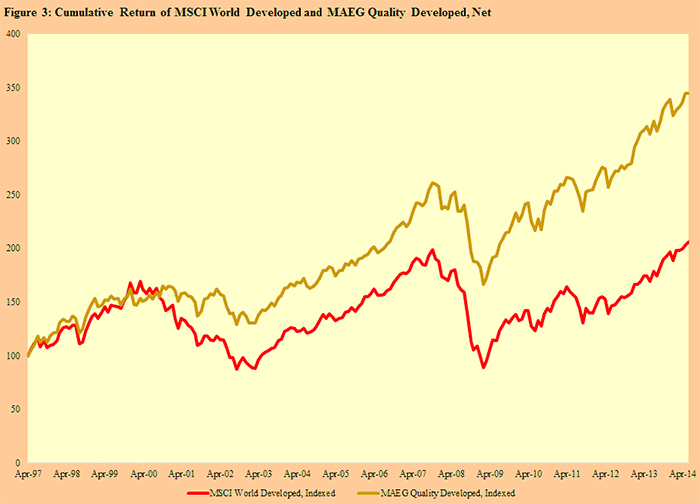
We now turn to risk and returns of quality businesses. Figure 3 shows the performance of the quality basket on a net basis14 as compared to that of MSCI World Developed Market Index. Because we selected our basket from a universe of all companies from developed markets, we consider this index to be the appropriate benchmark. The quality basket generated a compounded annual return of 7.4% as compared to 4.3% for MSCI World Developed Index. What is more, annualized standard deviations of monthly returns were lower for the quality basket at 12.6% as compared to 16.1% for the benchmark index. Over the same period, S&P 500 generated returns of 5.3% p.a. with annualized standard deviation of 15.8%.
Figure 3
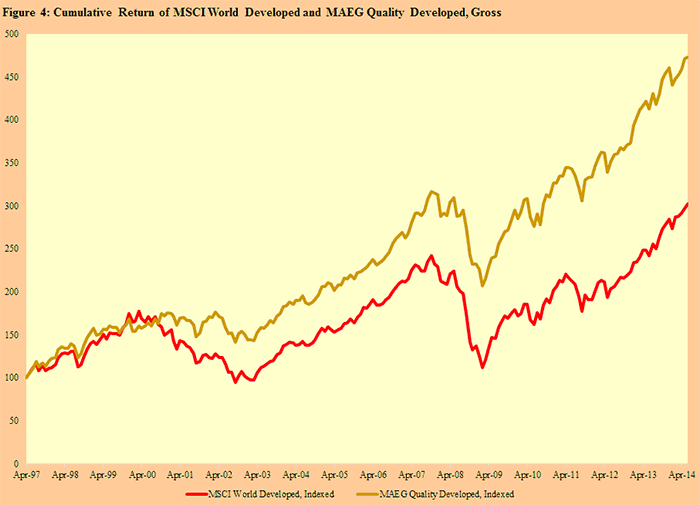
Figure 4 shows performance of the quality basket on a gross basis15 as compared to that of the benchmark index. The quality basket generated compounded annual return of 9.4% as compared to 6.6% for the benchmark index. The annualized standard deviations of returns were lower for the quality basket at 12.7% as compared to 16.1% for the benchmark index. Over the same period, S&P 500 generated returns of 7.3% p.a. with annualized standard deviation of 16.0%.
Figure 4
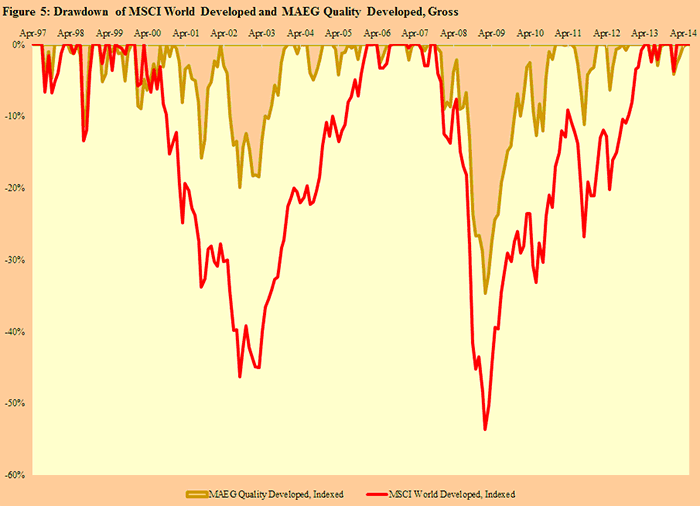
Figure 5 shows drawdown16 profiles of the quality basket and of the benchmark index. Clearly, the quality basket is significantly less risky when compared to MSCI World Developed Index as drawdowns aren’t only shallower; recovery to peak is quicker as well. We estimate the quality basket’s relative risk to be 55%17 of that of the benchmark index.
Figure 5
-
Risk and returns of our “manual” quality basket
As stated earlier, a key component of our quality-selection process does not lend itself to modeling. In this section, we analyzed performance of our actual quality basket, a basket that has to pass through our human analytical rigor as well as our systematic process.
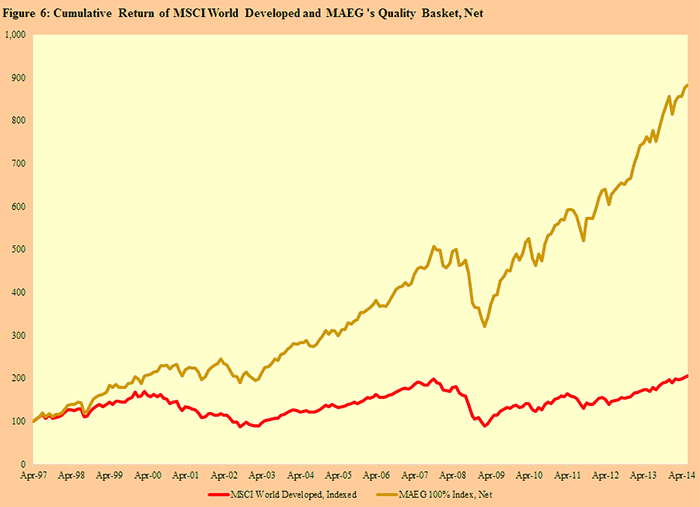
Figure 6 shows the performance of a basket of global equities that passed the muster of our analytical rigor as well as our systematic process on a net basis18 as compared to that of the benchmark index. Our research suggests that such a basket would have generated compounded annual return of 13.5% as compared to 4.3% for benchmark index between 1997 and 2014. The annualized standard deviations of returns were lower for MAEG’s Quality Basket at 14.8% as compared to 16.1% for the benchmark index. Over the same time frame, S&P 500 generated returns of 5.3% p.a. with annualized standard deviation of 15.8%.
An investment of $100 in April of 1997 in MAEG’s Quality Basket would have grown to almost $883 by June 2014 as compared to $206 in MSCI World Developed Index and $245 in S&P 500 Index.
Figure 6
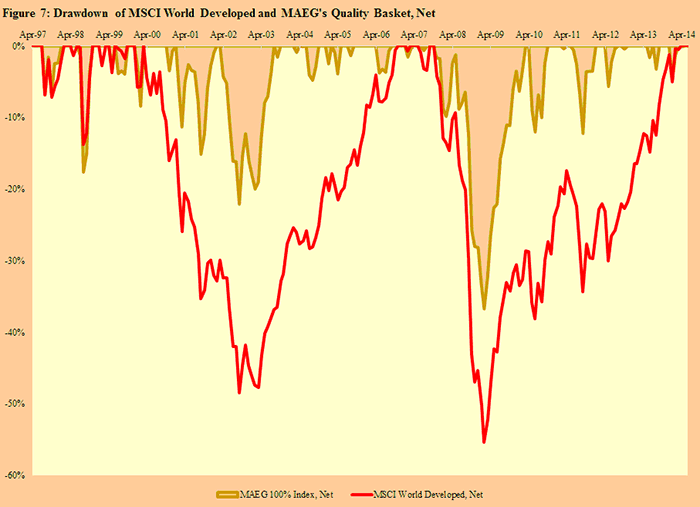
Figure 7 shows drawdown profiles of MAEG’s Quality Basket and of the benchmark index. Clearly, MAEG’s Quality Basket is significantly less risky when compared to MSCI World Developed Index as drawdowns aren’t only shallower; recovery to peak is quicker as well. We estimate the quality basket’s relative risk to be 57% of that of the benchmark index.
Figure 7
Summary
Our definition of quality includes quantitative as well as qualitative variables with sustainability of competitive advantage as a key factor.
A simple three-factor quantitative process for selecting HQ stocks outperforms the publicly traded benchmarks and does so with lower risk.
A manually selected list of HQ stocks would have generated substantially superior performance even when compared to the performance of quantitatively selected quality stocks.
Baijnath Ramraika, CFA, is a partner at Multi-Act Equiglobe (MAEG). Contact him at [email protected]. Prashant Trivedi, CFA, is a partner at MAEG and is the founding chairman of Multi-Act Trade and Investments Pvt. Ltd. Multi-Act is a financial services provider operating an investment advisory business and an independent equity research services business based in Mumbai, Maharashtra, India.
References
Novy-Marx, Robert (2013), “The Other Side of Value: The Gross Profitability Premium,” Journal of Financial Economics
Chan, K., Chan, L.K.C., Jegadeesh, N., Lakonishok, J., (2006), “Earnings quality and stock returns,” Journal of Business
George, Thomas J., and C.Y. Hwang (2010), “A Resolution of the Distress Risk and Leverage Puzzles in the Cross Section of Stock Returns,” Journal of Financial Economics
Read more articles by Baijnath Ramraika, CFA® and Prashant Trivedi, CFA®