Why Multifamily Housing is Booming (and Single-Family Isn't)
Membership required
Membership is now required to use this feature. To learn more:
View Membership BenefitsAdvisor Perspectives welcomes guest contributions. The views presented here do not necessarily represent those of Advisor Perspectives. This article originally appeared on the CFA Institute’s Enterprising Investor blog here, and you can subscribe to receive similar articles here.
The rebound in single-family housing has been tepid. Investors must understand the underlying structural changes, especially why demand has shifted toward multifamily housing and why this shift will persist in the years ahead.
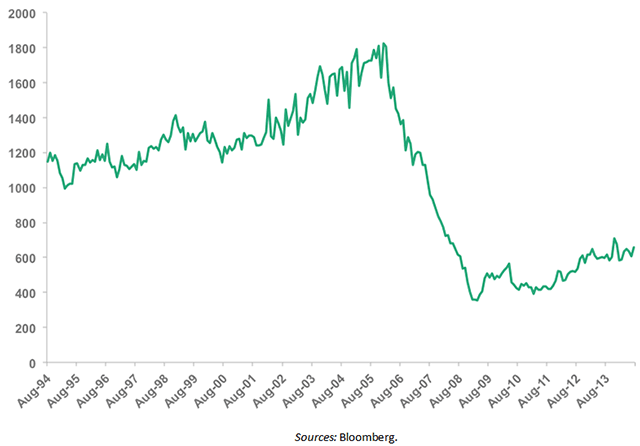
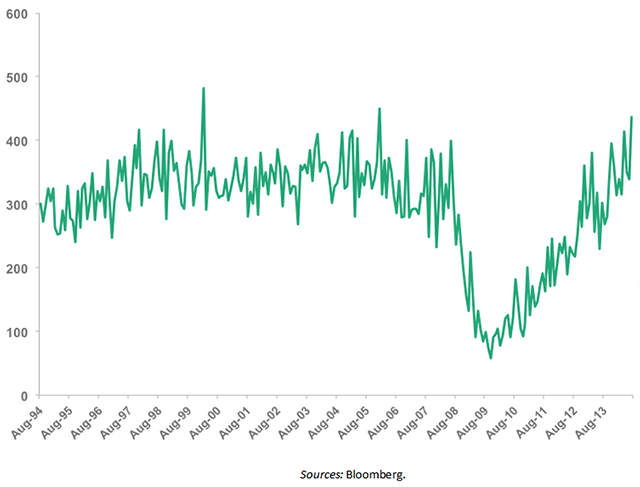
As shown below, the rebound in housing starts has been uneven between single-family and multifamily housing. Single-family housing has rebounded from a trough of approximately 400,000 annual starts to 650,000, but it remains well below the peak of 1.8 million in 2006. It’s a very different story in multifamily housing, in which housing starts are now at levels equal to or greater than pre-crisis at approximately 440,000.
Single-Family Housing Starts (In Thousands)
Multifamily Housing Starts (In Thousands)
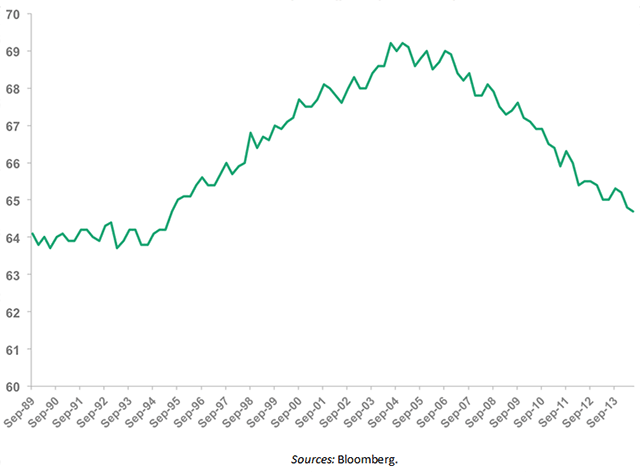
The strong rebound in multifamily housing is understandable from a number of perspectives. As shown below, the homeownership rate in the United States dropped to 64.7% as of June 30, 2014, which is the lowest it has been since 1995.
The rise of the homeownership rate starting in 1995 was driven by government policy. President Clinton unveiled “The National Homeownership Strategy” on May 2, 1995, which directed Housing and Urban Development Secretary Henry Cisneros to boost homeownership in America to an all-time high by the end of the century.
The government succeeded in its goal, but we all know how the housing boom ended.
Homeownership Rate
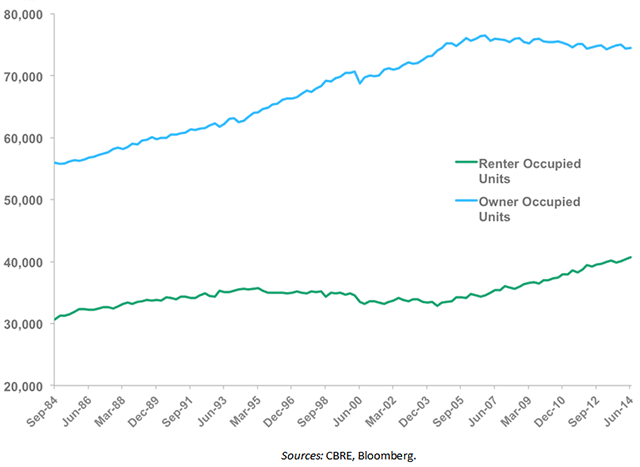
As shown by the chart below, and as would be expected by the plummeting homeownership rate, the number of owner-occupied housing units in total has fallen since the end of 2006, while the number of renter-occupied units is up approximately 18% in the same period.
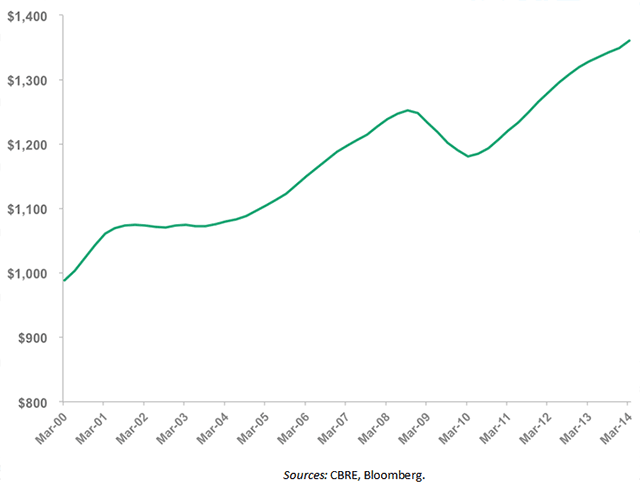
Despite the perceived “boom” in multifamily housing, the supply-and-demand picture paints a different story. Rental vacancy rates fell to 7.5% as of June 30, 2014, which is nearly a 20-year low. Rent prices continue to surge, and the average rent rate for multifamily properties is now some 8.5% higher than the 2008 peak, according to CBRE:
Owner- vs. Renter-Occupied Units
Average Rental Rate of Multifamily Properties
Why is this happening?
There are good explanations for why single-family construction has been weak while multifamily construction has rebounded sharply. Demographic data demonstrates that single-family occupied housing units exceeded the trend during the housing boom while multifamily badly lagged. A paper called “The Demographic Shift From Single-Family to Multifamily Housing” by Jordan Rappaport at the Kansas City Fed noted that “over the intermediate and longer term, demographic considerations are likely to dominate. In particular, the slowing of U.S. population growth will put significant downward pressure on both single-family and multifamily construction. The aging of the U.S. population will put further downward pressure on single-family construction but offsetting upward pressure on multifamily construction.”
Given the under-building of multifamily housing during the 2000s and the aging of the population, the current momentum of multifamily construction is not overdone. Rather, multifamily construction likely has many years to grow rapidly.
The GSEs are right in the thick of things
This wouldn’t be nearly as interesting of a story if the government-sponsored enterprises (e.g., Fannie Mae, Freddie Mac and Ginnie Mae) were not involved, but to no one’s surprise they are playing a very large role.
While getting a mortgage in the single-family world is much harder than it was pre-crisis, it is a very different situation in the multifamily world, where credit is flowing freely. One likely contributor to this is the recent boom in multifamily securitization by the GSEs.
Each has a different program. Fannie Mae has Delegated Underwriting and Service & Mega, Freddie Mac has the K-Series and Ginnie Mae has project loans. But overall, the securities have very predictable cash flows and have been in great demand among investors, driving spreads to razor-thin levels.
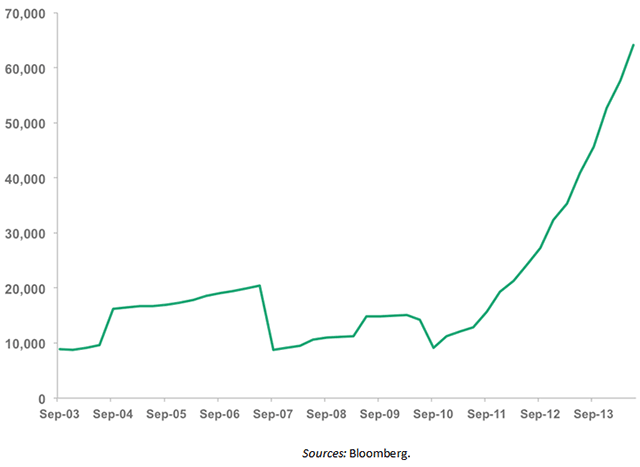
As shown below, Freddie Mac multifamily mortgage debt outstanding has exploded over 700% since 2010, led by the popularity of the Freddie K-series program. The credit quality of the underlying loans has remained near pristine thus far, but it is less clear if the quality will remain high with this much growth.
Freddie Mac Multifamily Mortgage Debt Outstanding
Overall implications
A secular movement towards multifamily housing led by demographics and changing preferences is a trend going forward. Further aiding this shift in our domestic housing “mix” is the relative availability of multifamily housing credit compared to single-family credit, which remains much tighter than in pre-crisis times.
The favorable financing environment is a great thing for the developers of multifamily housing, but the economic picture is more negative for the average renter. Rent prices continue to hit new highs, and vacancy rates are at multi-decade lows. Given that wage growth has remained anemic, renters across the country have been unable to keep up with rent increases, putting a strain on disposable income.
The investor community needs to stop waiting for a substantial rebound in single-family housing. Multifamily housing has already rebounded and will exhibit most of the growth going forward.
David Schawel, CFA, is based in Raleigh Durham NC and works as a fixed-income portfolio manager. His blog is Economic Musings and you can follow him on twitter at @davidschawel.
Membership required
Membership is now required to use this feature. To learn more:
View Membership BenefitsSponsored Content
Upcoming Virtual Events View All


