The supposedly safe move to shorten bond maturities in anticipation of rate increases has been very costly over the last three years – and there’s no reason to expect the next three will be any different. Here’s how to quantify those costs and position your portfolios in a way that makes money in a variety of interest-rate scenarios.
There's a broad consensus that interest rates are about to head upwards as the economy recovers and the Fed's bond market intervention comes to a messy conclusion. Depending on how rapid the rise, this could have a problematic or catastrophic impact on bond prices and your clients’ fixed-income allocations. Therefore, the very best thing you can do for your clients is confine their bond allocations to ultra-short maturities or floating-rate bonds, or set them up in a conservative bond ladder.
Are you willing to accept an unfair advantage as you build your business?
Bob Veres's Inside Information service takes you right to the cutting edge of new ideas, business-building insights, investment paradigms and marketing strategies as they arise from leading thinkers around the profession.
The service has been described as an "unfair advantage" by subscribers who are now among the most successful advisors in the business.
Knowledge is power. Try a year of Inside Information, with a money-back guarantee: www.bobveres.com, and give yourself the unfair advantage that you deserve in your professional career.
Best,
Bob Veres
Inside Information
Congratulations! You've just made a wise sector bet. And you did it with near certainty that the outcome, despite all the usual caveats about predicting the future, will be favorable for your clients' net worth.
Right?
This, of course, was the conventional wisdom around this time three years ago, and the reason it sounds so familiar is that it has been the conventional wisdom ever since. With the recent announcement by Fed Chairperson Janet Yellen that the taper is on schedule, short-term rates may increase and the Fed's future policy guidelines are more nebulous, you are hearing these same dire warnings even as we see a mild jump in Treasury yields.
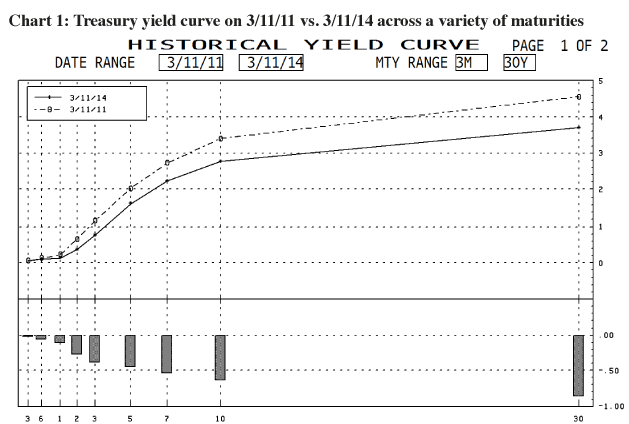
But if you look back over the past three years, it becomes clear that your wise sector bet actually lost your clients money. As the reader can see in Chart 1, prepared by Performance Trust Capital Partners in Chicago, interest rates actually went down over the last 36 months (ending March 11) across the entire spectrum of the Treasury yield curve. The interest rate drop ranged from just under 3 basis points for 3-month bills to 84 basis points on the 30-year bond.
"If you look at the graph of day-to-day rates, there was a lot going on. Rates were going up, and down and Europe was going to collapse," says Brian Battle, Performance Trust's director of analytics. "But at the end of the day, if you took a longer-term perspective, nothing happened in the bond market. You would have been far better off buying 5-year Treasury bonds and collecting 2% a year than hunkering down in 3-month bills at 7 basis points."
Are you kicking yourself? Probably not. "Opportunity costs are invisible unless you take the time to measure them," says Battle.
Knowing the future
Performance Trust Capital Partners is an institutional bond firm that has, until recently, offered advice on the bond market's opportunity set exclusively to banks, pension funds and other institutional investors. Since the company began offering similar services to professionals in the investment advisory world, its analysts have been startled to see how differently advisors view the fixed-income universe. "We're constantly hearing advisors say, I am either going down the credit spectrum to a BB-rated fund or lower-credit individual bonds because I need yield," says Jason Stuck, a director in Performance Trust's analytical division, "or: I am buying floating rate because I'm worried about rates going up."
What's wrong with that? Battle says that these off-the-cuff analyses fail to take into consideration the degree to which the future behavior of your bond investment is actually knowable – and mathematically measurable.
"A lot of the people we talk with in the advisor world are equity folks," Battle explains. "Whenever you start talking about the future, they're trained to think that you and I cannot possibly know anything about the future. And in the equity world, that's absolutely correct," he adds. "If I told you what Facebook's earnings are going to be next quarter, you would still have no clue what the stock price is going to be.”
"But," Battle continues, "with fixed income, there are at least a few things that are completely knowable. Fixed income investing is mathematics. Bonds pay a known amount of interest every six months, and they mature. If I own a 10-year bond today, next year I know that it is going to be a 9-year bond. Therefore, what are 9-year bonds worth today? What would they be worth if rates went up 200 basis points, or down 200 basis points? If you have Bond A and Bond B, and you buy them both at par, you can know with some certainty that one is going to go to 90 in a rates-up scenario, and the other one is going to go to 80. Which bond do you want to buy?"
Battle says that this predictability factor is the key difference between how you should be analyzing your stock versus bond components of a client's portfolio. "We know with complete certainty that rates will either be unchanged, they will go up or they will go down," says Battle. "It sounds simplistic, but that gives you a framework for modeling the different possible outcomes using different investment mixes. It lets you see, with some degree of certainty, which of them will come out best in terms of actual dollars in the pocket of the client."
Assessing the options
But what does this predictability exercise do for the advisor who has been expecting rates to come down for the past three years, and hasn't changed his outlook? What can you learn from the modeling exercise?
As it turns out, a lot. It is possible to know that the investment approach you're currently taking is guaranteed to cost your clients more money than some simple alternatives – no matter what the markets do.
Using a process called "shape management," Battle and his group will compare different combinations of the 240 different investable sectors of the fixed-income markets--corporates, Treasury bonds, munis, Fannie Mae/Freddie Mac bonds, TIPS, CDs, subordinate or mezzanine issues, callable steps, bullets and different flavors and durations of all of the above, with variable reinvestment rates based on each interest rate movement scenario: where rates go up or down 50 basis points, 100, 150, 200, 250 and 300 basis points over the next three years.
But there are limitations. "We are not making credit calls in these evaluations," says Stuck. "We don't think it's worth getting an extra 40 basis points to buy BBB-rated paper and hoping the bond doesn't default. Our whole focus is to manage interest-rate risk." He adds that Performance Trust's scenarios only go out three years because a longer horizon introduces too much uncertainty into the assumptions. "I am sure that rates won't be up 100 basis points in the next three days or the next three months," says Stuck. "But if I say the next four or five years, I become a lot less sure."
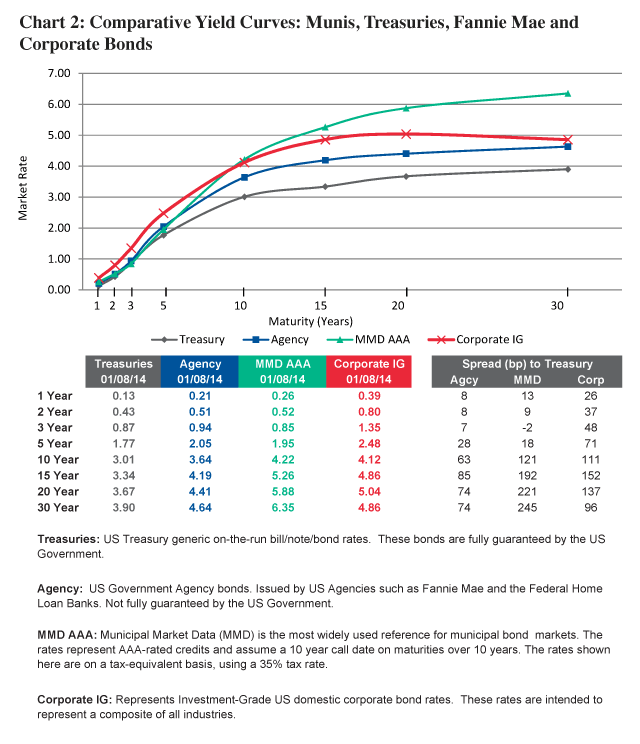
Within these parameters, the scenario analysis will give you some interesting insights. For starters, you can survey the opportunity set from a high altitude, as displayed in Chart 2. This shows the yields at each point in the yield curve, as of March 1 (pre-Yellen announcement) for high-quality muni bonds (green), investment-grade corporates (red), mortgage-based bonds issued by Fannie Mae or Freddie Mac (blue) and Treasuries (gray). In this graph, the yields are automatically adjusted to the highest tax rates, which is why, around eight years of maturity, munis start to dominate the alternatives. Interestingly, that also happens to be the steepest point of the ever-shifting yield curve for pretty much all of the alternatives – the back end of the highest slope which traditionally signals the yield curve's point of greatest opportunity.
Corporate bonds are roughly comparable to munis at that point in the graph, but Battle's eye is drawn to the muni option for two interesting reasons.
The first reason is greater diversification. Munis, he says, allow the predominately-equity portfolio to spread out its risk over a broader landscape. "A fixed-income portfolio of corporate bonds doesn't hedge out the risk of corporations, because you also own those companies in the stock portfolio," says Battle. "When you invest your fixed-income allocation in corporates, you're doubling up; you are not diversifying."
"We've talked with very sophisticated equity managers," adds Stuck, "and they will say: we buy corporates because we already know the credit. We already know this name."
"The problem with that strategy is: corporate credit is binary," Battle explains. "If Ford or Lehman goes out of business, you might get 20 cents on the dollar, and you might get zero. It is not like the muni market or an asset-backed security where you are going to get a recovery in the 70-90% rate."
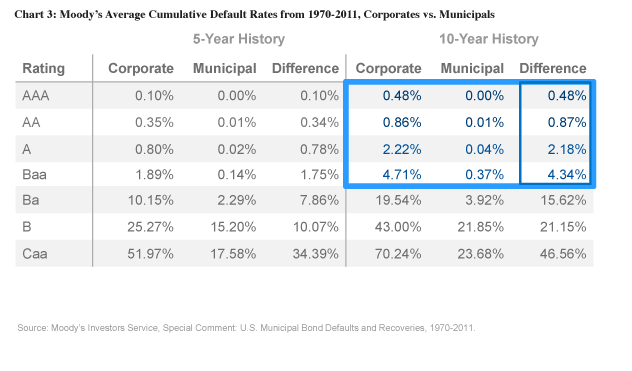
The second advantage to munis is their dramatically lower default rate as compared to corporate bonds. Stuck cites a report from Moody's Investor Services going back to 1970, which concluded that 10-year municipal bonds with an AAA, AA and A rating have experienced historical default rates of 0%, 0.01% and 0.04%. With corporates, the comparable numbers have been .48%, 0.86% and 2.22%. (See Chart 3) "The default rate on a AA-rated corporate is hundreds of times different than a one one-hundredth of a percent default rate on comparably rated munis," says Battle. "If the rates are comparable, that means you aren't getting paid to take on the additional corporate credit risk."
Shape management
Using that high-level overview, Battle can start to explore some possible scenarios – and let you compare your current bond allocation to alternative recommendations.
Suppose, for example, that you're anticipating higher interest rates. So you have your clients invested in money markets, which are generating the return on the Fed funds rate currently, and will not lose money even if interest rates rise to nearly 20%. Of course, you're not expecting anything that dramatic, but you do think that rates will go higher in the next three years. How much higher? Perhaps a parallel shift, across the yield spectrum, of 300 basis points?
As a more adventurous alternative, you might consider a bond ladder using muni bonds with 1-5 year maturities. This alternative will lose money, but along the way, you will be reinvesting the bonds that mature at higher rates.
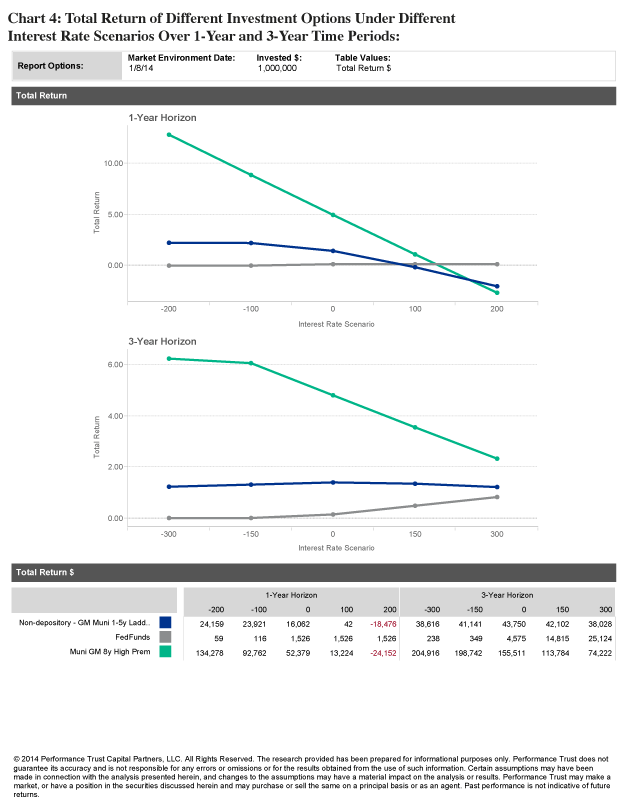
You can see shape management in action in Chart 4; your money market investment is the gray line, and your muni ladder is outlined in blue. The top graph shows a one-year time horizon, displaying the total return, in dollars (you can see the actual numbers at the bottom) if interest rates were to drop 200 basis points, or 100 basis points, if they were to stay where they are today, go up 100 or up 200 basis points. The lower chart shows a similar spectrum over three years, ranging from a drop of 300 basis points to a rise of 300 basis points.
You may have already noticed the green line, which represents a high-premium muni bond purchased at $111 with an eight-year maturity, yielding 5%. If you happen to be dramatically wrong in your forecast, and interest rates stay where they are or even decline a bit (as they have over the past three years), then a $1 million investment in that particular muni bond would generate $155,511 in coupon payments for the client's portfolio. This compares quite favorably with just $4,575 for the money market investment, and $43,750 for the bond ladder.
This part of the analysis gives you a rough measure of the opportunity cost over the past three years from staying ultra-short and making a sector bet when "everybody" knew that rates were going up.
The return difference is obviously going to be higher if rates fall dramatically between now and the first day of spring 2017, but chances are that's not the part of the analysis in which you're most interested. The startling conclusion of this analysis, graphed clearly with the actual numbers at the bottom, is that even if interest rates rise by 300 basis points in the next 36 months, crushing bond portfolios in their wake, the higher coupon bond still generates more dollars than the safe, conservative alternative that was designed to keep the client out of harm's way.
The three-year graph never shows the green line crossing under the blue or gray one. If rates go up exactly as many of us fear, the premium bond is still delivering $74,222 in actual dollars, even after the decline in the bond's after-market value is included. In actual dollars, this compares with just over $38,000 for the bond ladder and a little more than $25,000 for the money market investment.
This premium bond is obviously not the only option that you can or should consider. Battle says that when advisors bring him a case where a client has $1-10 million to allocate to bonds, he has to ask a lot of questions up-front before he even knows where to start looking. What's the client's tax rate? In what state does she live? Does the client need income? How much cash does she need to generate? What is the investment horizon?
In addition, every trading day the market offers new opportunities and takes others away, changing the recommendations that would be generated by the shape management process. The point here is that Battle isn't making a recommendation with Chart 3; he is trying to change the way equity-oriented advisors think about bonds.
"If you had $1 million to invest, and you're scared to death of rates rising, you might say, man, I'm going to put $1 million on the short end of the curve," he says. "What we're saying is: put $400,000 in cash and $600,000 in the 10-year, and no matter what happens, you are going to be better off. The issue here is that you count the dollars," he adds. "What are the best strategies based on the total dollars you end up with?"
Performance Trust has been conducting bond education workshops around the country, which can last anywhere from hours to several days, centered on the mathematics of bond investing. The next 3-day workshops will be held in New Orleans, LA on March 25-27, in Charleston, SC on April 7-9, May 5-7 in Denver, CO and May 20-22 in Columbus, OH. If you're interested in a trip to the Windy City, Performance Trust has given members of the Chicago FPA chapter a number of opportunities to attend shorter workshops, which will be rolled out to the rest of the country later this year.
But Battle has found that most advisors prefer to delegate, especially when they discover that the shape management analysis comes at no charge. (Performance Trust buys the bonds for clients and takes a disclosed markup as its revenue model.) In most cases, the advisor is trying to prevent incurring an opportunity cost, rather than create one, and is surprised to discover that his/her instinctive recommendation might not be optimal.
"Typically, an advisor will call and say: I've got this client who has $500,000 sitting in CDs at the bank, and he won't do anything because he's afraid that rates might go up," says Battle.
"We say, let's model what he has currently – which is cash – and look at potential futures. What's the scenario they're most fearful of? What can we find that will outperform cash in that worst-case world?"
“It so happens that in the bond world, we can show you the future," adds Stuck. "We are pretty confident of these data points if rates go up or down. We don't know which one of those scenarios will happen, so we model it and see which combinations offer the best overall return under the range of possible scenarios. After all," he says; "it's just math."
Bob Veres'Inside Informationservice is the best practice management, marketing, client service resource for financial services professionals. You can sign up for Inside Information ($299 a year) and a separate Client Articles service ($298 a year) which provides three or more Bob-written blog posts a month for your website or to send out to clients: www.bobveres.com.
Read more articles by Bob Veres