Safe withdrawal rate (SWR) studies have been based on a few asset classes and rarely incorporated international diversification. This is problematic, as an SWR depends on portfolio return and volatility, and broader diversification can extend the efficient frontier toward better retirement outcomes. To determine the benefits of international diversification, I looked at the relative performance of withdrawal rates in 20 developed-market countries.
My first study of retirement income investigated SWRs with domestic market data for a number of developed-market countries since 1900 using the Dimson, Marsh and Staunton global returns data provided by Morningstar. I asked whether prospective retirees should be comfortable basing retirement decisions on the impressive but perhaps anomalous numbers found in historical U.S. data. Indeed, over this historical time period and when compared to the other countries, the U.S. consistently enjoyed among the highest inflation-adjusted returns and lowest volatilities for stocks, bonds, bills and inflation.
What had been safe for U.S. retirees in the past was far less secure for our foreign counterparts.
Asset allocation does matter. As a refresher about international results, Table 1 shows historical outcomes for hypothetical retirees in each country, assuming they invested half of their assets in domestic stocks and half in domestic bonds. The results are sorted by SAFEMAX, the SWR for the worst-case scenario from history, and the table provides further details about outcomes using 4% and 5% withdrawal rates.
Of these countries, the U.S. was among the best performing.
|
Table 1
Sustainable Withdrawal Rates Around the World
With a Fixed Asset Allocation: 50% Domestic Stocks & 50% Domestic Bonds
|
|
Withdrawal Rate = 4%
|
Withdrawal Rate = 5%
|
|
SAFEMAX
|
SAFEMAX Year
|
10th Percentile
|
# Years in Worst Case
|
% Failures Within 30 Years
|
# Years in Worst Case
|
% Failures Within 30 Years
|
|
Denmark
|
3.68
|
1939
|
3.98
|
26
|
10.7%
|
19
|
57.1%
|
|
United
States
|
3.67
|
1966
|
4.02
|
24
|
8.3%
|
17
|
44.1%
|
|
Canada
|
3.66
|
1903
|
3.9
|
25
|
14.3%
|
16
|
44.1%
|
|
New
Zealand
|
3.6
|
1970
|
3.97
|
22
|
11.9%
|
15
|
46.4%
|
|
South
Africa
|
3.46
|
1937
|
4.05
|
24
|
7.1%
|
16
|
40.5%
|
|
Netherlands
|
3.24
|
1941
|
3.64
|
21
|
33.3%
|
16
|
57.1%
|
|
Sweden
|
3.23
|
1914
|
3.76
|
19
|
19.1%
|
13
|
54.8%
|
|
United
Kingdom
|
3.05
|
1900
|
3.35
|
19
|
23.8%
|
13
|
53.6%
|
|
Switzerland
|
2.92
|
1907
|
3.23
|
17
|
23.8%
|
12
|
48.8%
|
|
Australia
|
2.9
|
1970
|
3.56
|
16
|
17.9%
|
12
|
39.3%
|
|
Norway
|
2.72
|
1912
|
2.98
|
13
|
53.6%
|
9
|
67.9%
|
|
Ireland
|
2.6
|
1900
|
2.77
|
15
|
41.7%
|
11
|
65.5%
|
|
Spain
|
2.18
|
1973
|
2.61
|
10
|
50.0%
|
8
|
82.1%
|
|
Belgium
|
1.39
|
1911
|
1.65
|
8
|
56.0%
|
7
|
78.6%
|
|
Finland
|
1.34
|
1917
|
1.71
|
6
|
41.7%
|
5
|
53.6%
|
|
France
|
0.93
|
1943
|
1.62
|
7
|
61.9%
|
6
|
75.0%
|
|
Italy
|
0.9
|
1942
|
1.23
|
5
|
73.8%
|
4
|
79.8%
|
|
Germany
|
0.84
|
1911
|
0.96
|
3
|
54.8%
|
2
|
67.9%
|
|
Austria
|
0.26
|
1914
|
0.3
|
5
|
46.4%
|
5
|
61.9%
|
|
Japan
|
0.25
|
1937
|
0.29
|
3
|
35.7%
|
3
|
42.9%
|
|
Note: Assumptions include a 30-year retirement duration, no administrative fees, annual inflation adjustments for withdrawals and annual rebalancing.
|
|
Source: Own calculations from Dimson, Marsh and Staunton Global Returns Data (1900 – 2012)
|
My objective is to determine how international diversification would have changed these outcomes. Are globally diversified portfolios a panacea for retirees? To determine this, I calculated the local currency returns on stocks and bonds in 20 different nations for the same GDP-weighted “world” portfolio consisting of the 20 countries in the dataset. This allowed for 20 different perspectives on the role of international diversification, which is unique. The few existing studies on withdrawals rates with international diversification have only looked in the context of U.S.-based investors.
Table 2 has results comparable to Table 1, except that hypothetical retirees in each country invest 50% of their assets in a GDP-weighted portfolio of global stocks and 50% into global bonds, with returns in each country measured in terms of its local currency.
|
Table 2
Sustainable Withdrawal Rates Around the World
With a Fixed Asset Allocation: 50% Global Stocks & 50% Global Bonds
|
|
Withdrawal Rate = 4%
|
Withdrawal Rate = 5%
|
|
SAFEMAX
|
SAFEMAX Year
|
10th Percentile
|
# Years in Worst Case
|
% Failures Within 30 Years
|
# Years in Worst Case
|
% Failures Within 30 Years
|
|
New
Zealand
|
3.88
|
1910
|
4.14
|
28
|
6.0%
|
18
|
20.2%
|
|
Netherlands
|
3.63
|
1964
|
3.81
|
24
|
21.4%
|
16
|
42.9%
|
|
Australia
|
3.6
|
1907
|
3.96
|
23
|
10.7%
|
16
|
27.4%
|
|
Canada
|
3.39
|
1907
|
3.64
|
21
|
16.7%
|
15
|
25.0%
|
|
Sweden
|
3.35
|
1907
|
3.69
|
19
|
19.1%
|
13
|
42.9%
|
|
South
Africa
|
3.32
|
1910
|
4.25
|
20
|
8.3%
|
14
|
19.1%
|
|
United
States
|
3.31
|
1911
|
3.63
|
19
|
19.1%
|
13
|
31.0%
|
|
United
Kingdom
|
3.26
|
1907
|
3.55
|
19
|
17.9%
|
13
|
31.0%
|
|
Ireland
|
3.25
|
1907
|
3.53
|
18
|
19.1%
|
13
|
38.1%
|
|
Spain
|
3.13
|
1939
|
3.55
|
13
|
28.6%
|
8
|
46.4%
|
|
Denmark
|
3.13
|
1907
|
3.52
|
18
|
25.0%
|
13
|
46.4%
|
|
Finland
|
3.08
|
1906
|
3.3
|
14
|
27.4%
|
9
|
45.2%
|
|
Switzerland
|
3.05
|
1907
|
3.35
|
18
|
38.1%
|
13
|
51.2%
|
|
Norway
|
3.04
|
1907
|
3.49
|
17
|
26.2%
|
12
|
45.2%
|
|
Belgium
|
2.39
|
1937
|
3.06
|
11
|
35.7%
|
8
|
59.5%
|
|
France
|
2.34
|
1943
|
4.18
|
10
|
4.8%
|
8
|
42.9%
|
|
Japan
|
2.2
|
1946
|
3.22
|
10
|
40.5%
|
7
|
56.0%
|
|
Austria
|
1.69
|
1946
|
3.73
|
9
|
23.8%
|
7
|
44.1%
|
|
Italy
|
1.13
|
1944
|
4.44
|
5
|
6.0%
|
4
|
33.3%
|
|
Germany
|
0.13
|
1911
|
0.15
|
1
|
40.5%
|
1
|
61.9%
|
|
Note: Assumptions include a 30-year retirement duration, no administrative fees, annual inflation adjustments for withdrawals and annual rebalancing.
|
|
Source: Own calculations from Dimson, Marsh and Staunton Global Returns Data (1900 - 2012)
|
A casual comparison of Tables 1 and 2 indicates that more analysis will be needed, as the benefits of international diversification are mixed. Still, we can begin to see a clear tendency for global diversification to improve outcomes. In terms of the worst-case SAFEMAXs, global diversification did improve outcomes in 15 of the 20 countries. Japan enjoyed the largest gains, as the SAFEMAX rose from 0.25% with a domestic portfolio to 2.2% with a global portfolio. Finland, as well, enjoyed an increase in the worst-case scenario from 1.34% to 3.08%. The five countries with reduced SAFEMAXs had consistently strong-performing domestic markets. Four of the five (Denmark, U.S., Canada and South Africa) were ranked in the top five for the SAFEMAX with domestic assets.
For global diversification to be effective, it is important to see outcome improvements in cases when domestic markets led to abysmal results. Table 3 provides a perspective after combining all of the SWRs over the historical time period and across the 20 countries. Withdrawal rates supported with domestic assets are tabulated for different levels, and for each level the table shows whether global diversification improved or worsened outcomes.
In total, global diversification resulted in higher withdrawal rates in 66.4% of the historical cases across countries. As well, globally, the success rate of the 4% rule with domestic assets was 65.7%, but it rose to 78.3% with globally diversified portfolios. This compares to the 91.7% historical success for 4% in the U.S. as seen in Table 1 (as a reminder, the 4% rule suggests that one can withdraw 4% of their retirement date assets, adjust that amount for inflation in subsequent years, and not run out of wealth for at least 30 years).Table 3 also demonstrates the tendency for diversification to improve results when domestic assets supported low withdrawal rates. Indeed, diversification improved results in more than 50% of the cases for withdrawal rates below 7.5%.
|
Table 3
Impact of International Diversification Across 20 Countries
for 50/50 Asset Allocations
|
|
Globally Diversified Portfolios
|
|
Withdrawal Rate with Domestic Assets
|
Percentage of Cases with Withdrawal Rates in This Range
|
Cumulative Percentage
|
Percentage of Cases with Reduced WR
|
Percentage of Cases with Increased WR
|
|
0 - 0.5
|
1.8%
|
1.8%
|
0.0%
|
100.0%
|
|
0.5 – 1
|
1.4%
|
3.2%
|
45.8%
|
54.2%
|
|
1 - 1.5
|
2.3%
|
5.5%
|
23.7%
|
76.3%
|
|
1.5 – 2
|
2.4%
|
7.9%
|
2.4%
|
97.6%
|
|
2 - 2.5
|
4.1%
|
12.0%
|
1.5%
|
98.6%
|
|
2.5 – 3
|
4.9%
|
16.9%
|
2.4%
|
97.6%
|
|
3 - 3.5
|
7.1%
|
24.1%
|
7.5%
|
92.5%
|
|
3.5 – 4
|
10.2%
|
34.3%
|
18.0%
|
82.0%
|
|
4 - 4.5
|
12.8%
|
47.1%
|
29.3%
|
70.7%
|
|
4.5 – 5
|
11.0%
|
58.0%
|
40.8%
|
59.2%
|
|
5 - 5.5
|
8.4%
|
66.4%
|
45.4%
|
54.6%
|
|
5.5 – 6
|
6.9%
|
73.3%
|
55.2%
|
44.8%
|
|
6 - 6.5
|
5.7%
|
79.0%
|
45.8%
|
54.2%
|
|
6.5 – 7
|
4.8%
|
83.8%
|
41.3%
|
58.8%
|
|
7 - 7.5
|
3.2%
|
87.0%
|
40.7%
|
59.3%
|
|
7.5 – 8
|
2.8%
|
89.8%
|
51.1%
|
48.9%
|
|
8 - 8.5
|
2.6%
|
92.4%
|
61.4%
|
38.6%
|
|
8.5 – 9
|
1.5%
|
93.9%
|
56.0%
|
44.0%
|
|
9 - 9.5
|
1.7%
|
95.6%
|
53.6%
|
46.4%
|
|
9.5 - 10
|
0.8%
|
96.4%
|
57.1%
|
42.9%
|
|
10 +
|
3.6%
|
100.0%
|
80.0%
|
20.0%
|
|
Aggregate
|
33.6%
|
66.4%
|
|
Note: Same assumptions and data source as Table 1.
|
|
Table 3
Impact of International Diversification Across 20 Countries
for 50/50 Asset Allocations
|
|
Globally Diversified Portfolios
|
|
Withdrawal Rate with Domestic Assets
|
Percentage of Cases with Withdrawal Rates in This Range
|
Cumulative Percentage
|
Percentage of Cases with Reduced WR
|
Percentage of Cases with Increased WR
|
|
0 - 0.5
|
1.8%
|
1.8%
|
0.0%
|
100.0%
|
|
0.5 - 1
|
1.4%
|
3.2%
|
45.8%
|
54.2%
|
|
1 - 1.5
|
2.3%
|
5.5%
|
23.7%
|
76.3%
|
|
1.5 - 2
|
2.4%
|
7.9%
|
2.4%
|
97.6%
|
|
2 - 2.5
|
4.1%
|
12.0%
|
1.5%
|
98.6%
|
|
2.5 - 3
|
4.9%
|
16.9%
|
2.4%
|
97.6%
|
|
3 - 3.5
|
7.1%
|
24.1%
|
7.5%
|
92.5%
|
|
3.5 - 4
|
10.2%
|
34.3%
|
18.0%
|
82.0%
|
|
4 - 4.5
|
12.8%
|
47.1%
|
29.3%
|
70.7%
|
|
4.5 - 5
|
11.0%
|
58.0%
|
40.8%
|
59.2%
|
|
5 - 5.5
|
8.4%
|
66.4%
|
45.4%
|
54.6%
|
|
5.5 - 6
|
6.9%
|
73.3%
|
55.2%
|
44.8%
|
|
6 - 6.5
|
5.7%
|
79.0%
|
45.8%
|
54.2%
|
|
6.5 - 7
|
4.8%
|
83.8%
|
41.3%
|
58.8%
|
|
7 - 7.5
|
3.2%
|
87.0%
|
40.7%
|
59.3%
|
|
7.5 - 8
|
2.8%
|
89.8%
|
51.1%
|
48.9%
|
|
8 - 8.5
|
2.6%
|
92.4%
|
61.4%
|
38.6%
|
|
8.5 - 9
|
1.5%
|
93.9%
|
56.0%
|
44.0%
|
|
9 - 9.5
|
1.7%
|
95.6%
|
53.6%
|
46.4%
|
|
9.5 - 10
|
0.8%
|
96.4%
|
57.1%
|
42.9%
|
|
10 +
|
3.6%
|
100.0%
|
80.0%
|
20.0%
|
|
Aggregate
|
33.6%
|
66.4%
|
|
Note: Same assumptions and data source as Table 1.
|
For a final perspective, Table 4 shows the percentage of historical simulations in which globally diversified portfolios performed better than portfolios of domestic assets. Of the 20 countries, only in Denmark, Germany, and Japan did globally diversified portfolio improve results less than half the time. For the U.S., the results were evenly split, though most countries had better overall results with the globally diversified portfolio.
|
Table 4
Percentage of Historical Cases in Which Globally Diversified Portfolio Outperformed Domestic Portfolio
|
|
Australia
|
66.7%
|
|
Austria
|
67.9%
|
|
Belgium
|
86.9%
|
|
Canada
|
52.4%
|
|
Denmark
|
47.6%
|
|
Finland
|
70.2%
|
|
France
|
83.3%
|
|
Germany
|
39.3%
|
|
Ireland
|
81.0%
|
|
Italy
|
97.6%
|
|
Japan
|
42.9%
|
|
Netherlands
|
72.6%
|
|
New Zealand
|
67.9%
|
|
Norway
|
65.5%
|
|
South Africa
|
54.8%
|
|
Spain
|
77.4%
|
|
Sweden
|
63.1%
|
|
Switzerland
|
61.9%
|
|
UnitedKingdom
|
78.6%
|
|
United States
|
50.0%
|
|
Note: Same assumptions and data source as Table 1.
|
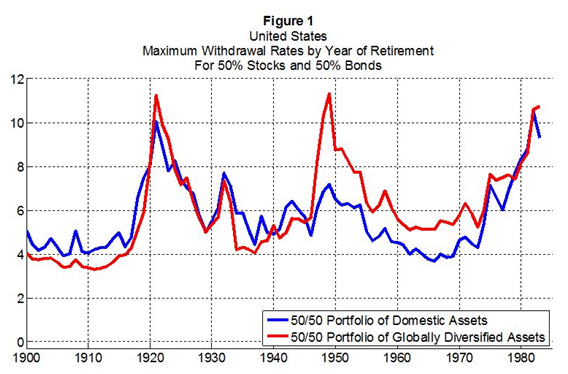
Figure 1 illustrates the historical results for the U.S. We know from the previous table that the red line (globally diversified) is above the blue line (domestic assets) in half of the cases. This figure illustrates the historical trend of that division more clearly. Retirees in the early 1900s were better off with domestic portfolios. But from the end of World War II until about 1980, globally diversified portfolios provided significantly better results than domestic-only portfolios.

The bottom line
Global diversification is not a universal panacea for SWRs, though historically, retirees have enjoyed advantages from globally diversified portfolios. When aggregated across countries, the success rates for a 4% withdrawal rate with 50/50 portfolios over 30 years rose from 65.7% with only domestic assets to 78.3% with globally diversified assets. While global diversification did improve outcomes, there is still a 22.7% failure rate for the 4% rule with global portfolio returns measured in terms of the local currency. Clients can expect better outcomes with international diversification, but even with this greater diversification, there is still a chance that 4% will not work and adjustments to spending patterns or asset allocations will be needed in retirement.
Wade D. Pfau, Ph.D., CFA, is a professor of retirement income in the new Ph.D. program in financial services and retirement planning at the American College in Bryn Mawr, PA. He is also the director of retirement research for inStream Solutions and McLean Asset Management. He activelyblogs about retirement research. See his Google + profile for more information.
Read more articles by Wade Pfau