Advisor Perspectives welcomes guest contributions. The views presented here do not necessarily represent those of Advisor Perspectives.
In the past three years, as the major stock indexes have appreciated, public-company valuations have stretched to progressively higher multiples of earnings. These valuations have increased1 at the same time as the average S&P 500 constituent company has generated unusually high earnings on each sales dollar.
Some argue that because of the relative attractiveness of the U.S. economy and the unattractiveness of bonds, the stock market has much more room to run. So it may. However, the market can now lose in two obvious ways: valuations, as multiples of earnings, may fall to historical norms, and companies’ earnings may fall should operating margins revert toward historical averages.
Given these risks, it is worthwhile to consider which approach will serve you best in the uncertain periods ahead – focusing on investing in the best companies, or aiming to find the lowest priced opportunities? It also is a good time to ask how value-oriented investment approaches, such as Joel Greenblatt’s “magic formula”, would have performed when price-to-earnings multiples compressed in the past? A recent study we completed yields some perspective on these two questions.
The “magic formula”
Joel Greenblatt is a prominent value investor who wrote the easy-to-read book, The Little Book That Beats The Market. In his book, Greenblatt presented a “magic formula” for buying what he considered to be good companies at good prices. He also shared evidence that one would have achieved a better-than-market return by adhering to his formula from 1988 to 2004.
Greenblatt’s concepts – good companies and good prices – are represented by two financial statement ratios: a high return on invested capital (ROIC) represents a “good company,” and a high earnings yield (EY) represents a “good price”2. The definitions of both ratios used in our study are provided in the footnote. Here is an easy way to think about them:
- ROIC tells you how much cash a company generates in relation to the amount of capital tied-up in its business. As ROIC numbers increase, all else being equal, a business gets better and better. The reason is that the higher a business’s ROIC, the more money it pockets each year in relation to the money that has been invested in the business.
- EY tells you how expensive a company is in relation to the earnings the company generates. When looking at EY, we make certain adjustments to a company’s market capitalization to estimate what it would take to buy the entire company. This involves penalizing companies that have a lot of debt and rewarding others that have a lot of cash.
Greenblatt’s magic formula gives these two ratios equal weight when selecting investments. His formula ranks all companies in the investable universe by good company (ROIC) and good price (EY). Then, each company’s ROIC and EY ranks are added together. Greenblatt’s formula has investors buy companies with the best combined rankings, hold each company for a year and then rebalance by investing in new highly ranked companies.
Our two questions
We examined two questions about Greenblatt’s formula as part of the study:
- When selecting investments, what matters more: investing in good companies or making investments at good (that is, low) prices? Put another way, should EY and ROIC be weighted equally? What occurs if one is given more weight in the ranking system?
- Greenblatt’s study focused on the period from 1988 to 2004. How would this approach have performed across a longer period of time? Are there interim periods when this approach might have done well or poorly?
We hope you find our insights informative regarding the magic formula itself and also how this strategy of buying good companies when they are “on sale” performed during periods when the average company’s valuation contracted as a multiple of earnings.
1. Professor Robert Shiller of Yale University invented the Schiller P/E to measure the market's valuation. The Schiller P/E looks at the S&P 500 index level in relation to the 10-year average inflation-adjusted, annual earnings for the S&P 500 constituent companies. The current Shiller P/E ratio of 25.4 is approximately 50% higher than its historical average (from 1880 through today) of 16.5.
2. ROIC = (Earnings Before Interest & Taxes + Depreciation – CapEx) / (Net Working Capital + Net Fixed Assets)
Earnings Yield = (Earnings Before Interest & Taxes + Depreciation – CapEx) / Enterprise Value (Market Value + Debt – Cash)
The study and simulation assumptions
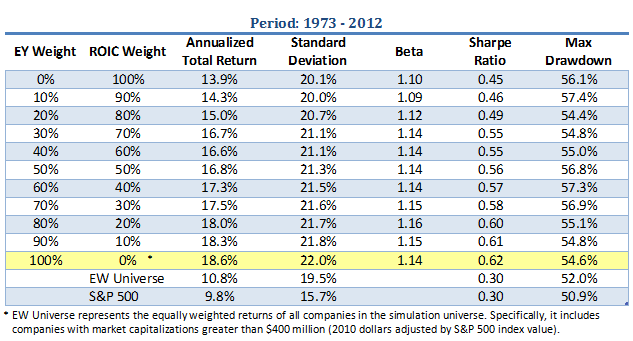
Our study examined the performance of 10 different weightings of ROIC and EY during the 40-year period from 1973 to 2012. We had two goals. First, find the combination that performed best during that period. Second, seek insight regarding environments in which different combinations yielded better results.
In these simulations, we adopted certain assumptions. We set the investable universe to include all companies with market capitalizations that were greater than $400 million in 2010 dollars. As a $400 million company meant something different in 2010 than in 1973, we adjusted the target portfolio assets and the minimum market capitalization by the S&P 500 Index value going back in time.3, 4
The simulations looked at 10 different portfolios, each with 50 holdings. We constructed the portfolios by ranking all companies in the investable universe by EY and ROIC, and then combining the ranks based on each of 10 different weightings. Thus, we had portfolios built with 100% ROIC/0% EY on one end of the spectrum, then 90%/10%, 80%/20%, all the way to 0% ROIC/100% EY. In the Appendix, we share other important assumptions used in these simulations.
Simulated results
Across the 40 years of these simulations, the best-performing portfolio was the one that focused solely on buying companies at very low prices. The 100% EY portfolio compounded at 18.6%, whereas the 50/50 and 100% ROIC portfolios returned 16.8% and 13.5%, respectively. Any inclusion of the concept of “good company” as represented by ROIC reduced long-term returns.

Here are several observations on these results:
- Meaningful differences in compounded rates of return create stunning differences over long-term periods. Across the 40 years, $1 invested in the S&P 500 would have grown into $40. Meanwhile, $1 would have grown to $185 for the ROIC-only portfolio, $500 for the 50/50 portfolio and $925 for the EY-only portfolio. When thinking about these numbers, note that inflation during this period averaged more than 4%, and the real value of $1 in 1973 would be less than $0.20 today.
- This study certainly does not settle the question of what matters more when selecting investments: good companies or good (that is, low) prices. This study does, however, raise the question of whether a company’s last-year ROIC provides the best lens for assessing whether that company is “good” or not.
- Even so, the portfolio focused solely on ROIC outperformed the broader market. A big lesson, perhaps, is that by ignoring external factors and focusing on something valuable and intrinsic to a business, like ROIC, you can do well across long periods even if you are not price-sensitive. Of course, the results show you do much better by being highly sensitive to price.
3. For example, as the S&P 500 Index was approximately 1130 in January 2010 and just above 620 in January 1996, the $400 million minimum market capitalization threshold for 2010 would have been approximately $220 million at the start of 1996.
4. This assumption creates results that differ from Greenblatt’s. In Greenblatt’s book, his investable universe consists of the 3,500 largest domestic companies. By limiting our simulations to companies with market capitalizations of $400 million or more in 2010 dollars, there is an average of 1,500 companies in our investable universe across the period 1973-2012. As you might expect, by investing in a smaller investment universe and thus having access to fewer opportunities, our simulated returns are considerably lower than those Greenblatt shared in his book.
Results by type of environment
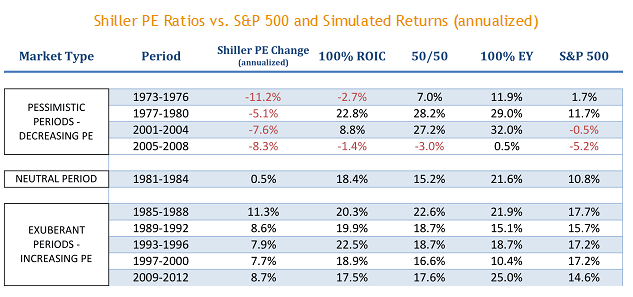
The results get even more interesting when you look at them in shorter time slices. For example, though the 100% EY-portfolio did best across the 40-year period, the 100% ROIC portfolio won in the 1990s.5 Why might this be? Perhaps in periods like the 1990s in which the stock market roared ahead without major drawdowns (such as the market experienced in 1973-1974, 2000-2002 and 2007-2009), you are rewarded for investing in the best of the good companies regardless of price. In addition, digging into shorter time slices helps makes sense of others’ observations. For example, Greenblatt’s book talked about the merits of a 50/50 weighting between ROIC and EY. His study focused on the period 1988-2004, a period in which the 50/50 portfolio in our study also outperformed the other simulated portfolios.
Though each slice in time tells a slightly different story, a broad insight can be gained by looking at the entire simulation segmented by optimistic and pessimistic periods.
Periods of optimism and pessimism
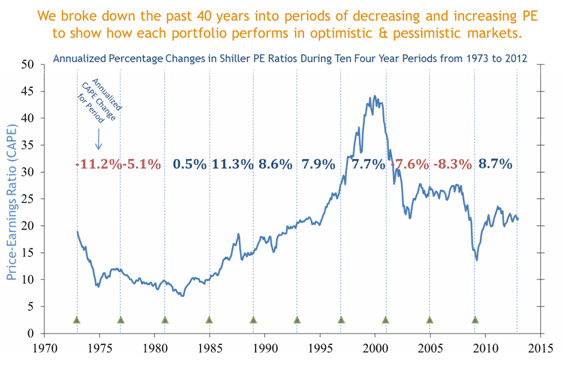
Professor Robert Shiller of Yale University invented the Shiller P/E (also known as the cyclically-adjusted PE or CAPE) to measure the market's valuation. The Shiller P/E looks at the S&P 500 index level in relation to the long-term (trailing 10-year) earning power of the index’s constituent companies. We used the Shiller P/E to segment the simulation period into optimistic and pessimistic periods.
The first step was to divide the study into 10 four-year segments. We grouped those four-year segments into pessimistic and optimistic periods. Pessimistic periods were those in which the Shiller P/E decreased during the four-years. Optimistic periods were those in which the Shiller P/E was rising. In the following chart, you can see how the Shiller P/E evolved over the simulation period.
Next, we looked at the returns of the S&P 500 and three simulated portfolios – 100/0, 50/50, and 0/100 weightings of ROIC and EY – grouped into these pessimistic and optimistic periods.
The best weighting of ROIC and EY depended on the type of environment. During optimistic times, investors would often have done better by not being price sensitive. Then again, every approach – including being indexed to the market – did well during optimistic times. However, in pessimistic periods when price-to-earnings multiples compressed, there is an overwhelming advantage to investing in the least-expensive companies (e.g., those with the highest earnings yields).
Implications for advisors
We are always amazed by how well one can do across long periods by committing to a simple approach for selecting investments based on companies’ intrinsic qualities. Whenever we explore variations on this theme, our conviction deepens in the merits of applying a systematic approach to investing in good companies at good prices.
This study, however, shows that there may be an opportunity to do better by thinking more deeply about what makes for a good company and a good price.
For example, we believe there are better ways of assessing a company’s true character – that is, the “goodness” of a company – than simple measures such as last year’s ROIC. We expect that one would do much better by developing a nuanced understanding of a company through the relationships between its long-term operating history, consistency of operations, riskiness of its balance sheet and rate of growth.
We also feel that concepts like return on capital and earnings yield are better examined over longer periods of time than just one year. It makes sense that this might be the case. After all, companies can make certain accounting decisions, such as how they value inventory, that impact the timing of earnings. Two companies that are the same in every way except for a different accounting choice can show different quarterly and annual results. These differences generally average out when companies are examined over long periods. In addition, consider what you really care about as an investor. Do you care that a company had a good year and is cheap based on its last-year earnings? Or do you care that you are buying a company that has a consistent track record of generating results and is inexpensive based on its long-term, demonstrated earning power?
Of course, in any given year or period, the approach that works best depends on the circumstances. For example, if you looked just at the late 1990s, you could conclude from the data that buying growing companies at any price was a sound strategy. But when you look across several decades, the message is very clear – adhering to value-oriented strategies and buying good companies when they are offered at low prices is a timeless method for achieving superior results.
Mike Seckler and John Alberg are the managers and founders of Euclidean Technologies Management, a Seattle- and New York City-based investment advisor specializing in systematic value investing. Prior to starting Euclidean in 2008, John and Mike co-founded Employease, a software-as-a-service provider that Automatic Data Processing (NASDAQ:ADP) acquired in 2006. Both John and Mike graduated from WIlliams College in 1994.
5. To keep this article at a reasonable length, we have not included the returns by decade detail. We are happy to share this information with you. Just call or email us at Euclidean Technologies Management anytime.
Appendix – Simulation Assumptions
- The historical simulation results herein do not represent the results of actual trading and may not reflect the impact that material economic and market factors may have had on the adviser’s decision making if the adviser were actually managing client money. The simulated results were achieved through the retroactive application of a model designed with the benefit of hindsight. No investment strategy or risk management technique can guarantee return or eliminate risk in any market environment.
- In the simulation, Standard & Poor’s Compustat database was used as a source for all information about companies and securities for the entire simulated time period. From 1987 to 2012, Computstat’s Snapshot (Point-In-Time) database was used such that the simulation processed financial data concurrent with the time that the financial data became available to the public. Prior to 1987, the period when the timing of company financial data releases has been less comprehensively cataloged, the simulations assume that financial data was not available to investors until 90 days following the end of the applicable fiscal quarter.
- The simulations were restricted to non-financial companies listed on the NYSE, NASDAQ, and AMEX stock exchanges.
- The simulations assumed $100M assets under management and assumed that the investable universe includes all companies with market capitalizations greater than $400M, with both assumptions in 2010 dollars. As a $400M company meant something different in 2010 than in 1973, the simulations adjusted the target portfolio assets and the minimum market capitalization by the SP500 Index value going back in time. For an example, as the SP500 Index was around 1130 in January 2010 and just under 620 in January 1996, the $400M minimum market capitalization threshold for 2010 would have been approximately $220M at the start of 1996.
- Companies in the investable universe were ranked by Earnings Yield and Return on Invested Capital (ROIC). In each of the ten simulations, these ranks were combined by a specific weighting of Earnings Yield and ROIC. For example, one simulation’s weighting was 30% Earnings Yield and 70% Return on Invested Capital, whereas another simulation’s weighting was 80% Earnings Yield and 20% Return on Invested Capital. Each simulation invested in the 50 companies with best combined ranks of that simulation’s respective weighting of Earnings Yield and ROIC.
- To minimize the potential impact, positive or negative, of market timing and to show how an equally-weighted, 50-position portfolio might have performed at each point in time, the portfolios were rebalanced monthly to equally weight the 50 securities in each portfolio.
- The purchase and sale price for a security was the volume-weighted average closing price for the security over the first 10 trading days of each month. The simulations assumed a trading cost of $0.02 per share. The simulations also assumed a maximum participation of 15% of a target holding’s daily volume over the 10-day trading window.
- For the model and the S&P 500, the annual returns presented are calculated by compounding the monthly returns (including dividends) between Dec 31st of the prior year and Dec 31st of the current year.
- The simulation performance does not reflect the deduction of any investment advisory fees.
- Back-tested performance results have certain inherent limitations. No representation is being made that any model or model mix will achieve performance similar to that shown. Simulated performance and actual prior performance provide no guarantee of future performance.
Read more articles by John Alberg and Michael Seckler