This is part three of a three-part series of articles reviewing stand-alone income (SALB) guarantees. Part one of this series is available here and part two is here.
What is the purpose of an income guarantee? Some view it as a traditional insurance product, meant to provide downside risk protection, while others like that it encourages clients to accept a more aggressive asset allocation, promising more upside without exacerbating worst-case outcomes. Can it really be both?
Some would argue that guarantees aren’t worth bothering with at all, since many clients can expect to do just as well without paying the extra fees.
So who’s right?
In this third and final installment in my series on guarantee riders, I’ll focus on the post-retirement income supported by income guarantee riders for variable annuities (VA/GLWBs), stand-alone living benefit riders (SALBs), and an unguaranteed portfolio of mutual funds. I’ll highlight how differences among these products affect their end results, while also investigating what roles guarantees can most appropriately play in a retirement portfolio.
Setting the stage
For many advisors, it’s a welcome relief that clients no longer have to permanently commit their assets to a deferred variable annuity in order to purchase a rider that guarantees lifetime withdrawal benefits. The RetireOne product from ARIA is one such rider – it can be applied to a portfolio of mutual funds – and for this analysis, it is the one that I’ve focused on. The relatively low-cost GLWB rider available for Vanguard’s variable annuities, meanwhile, is what I’m using as a relatively attractive example of an annuity rider.
For a full refresher on the background and features for VA/GLWBs and SALBs, I’d recommend reviewing part 1 in this series. Very briefly, these products are designed to provide owners with downside protections, upside potential, and the opportunity to have remaining assets returned prior to death or as a death benefit. To accomplish this, these riders guarantee an income for life at a fixed withdrawal percentage of the initial assets. As long as the investor does not exceed the allowed withdrawal amounts, guaranteed withdrawals never decrease (in nominal terms – they may well decline according to inflation-adjusted metrics), even if the account balance falls to zero. If the value of the underlying account increases enough (after accounting for any withdrawals and fees), a step-up feature kicks in to provide permanently higher withdrawal amounts.
I’ve simulated the income-phase performance of the Vanguard VA/GLWB, the RetireOne SALB, and an unguaranteed mutual fund portfolio using Monte Carlo simulations. Parts 1 and 2 of the series, linked above, focused on the initial deferral period and the crucial moment when the income guarantee kicks in, respectively, relying on historical data. This final article will shift gears to consider the results of my simulation and their implications for the income phase of retirement.
Potential biases in research methodologies
Income guarantees are complicated financial products, and it’s important to understand that the research published about them often makes assumptions that can present the guarantees in an overly positive or negative light. Let’s review some of the most crucial.
Underlying fees: A particularly common approach in such research is to compare the results of using income guarantees to drawdowns from unguaranteed mutual funds. Readers must pay careful attention to the fees that are assumed to underlie those guaranteed and unguaranteed funds, which should be consistent across the different products. (That’s why I compare the low-cost RetireOne guarantees with Vanguard’s low-cost VA/GLWB and with unguaranteed low-cost index funds.)
Asset Allocation: Clients with income guarantees will naturally feel more comfortable accepting an aggressive asset allocation, and ideally one should compare approaches using the asset allocations a client would actually choose with a guarantee and without one, rather than assuming a one-size-fits-all approach.
Underlying Returns: For obvious reasons, assumptions about expected returns can dramatically affect the results. With better performance and lower inflation, guaranteed approaches will reap the benefits of their higher upside when compared with a less-aggressive, unguaranteed approach, but the unguaranteed approach will also be more likely to support the corresponding guaranteed withdrawals. In other words, there will be less downside risk for the guarantee to protect. With more pessimistic return assumptions, there will be fewer step ups and less upside, but the guarantee becomes much more likely to matter.
Time Period: Assuming a longer retirement horizon skews results toward guarantees, since over time it becomes more and more likely that the unguaranteed portfolio will run dry. Some researchers believe that the appropriate time period to investigate is remaining life expectancy, while others opt for something like a 30-40 year retirement, aiming for the high end of realistic scenarios.
Spending Rates: Finally, one way to make a guarantee look better is to guarantee only part of a portfolio while assuming that total spending will exceed the guaranteed payout rate. Doing so causes both an unguaranteed portfolio and a partially guaranteed portfolio to deplete more quickly, but the partially guaranteed portfolio will still look better, since it continues to at least provide a minimal amount of income. In either case, however, income may fall well below the basic needs of a client, who should have been advised to choose lower spending rate from the outset. (To avoid this problem, I simply compare the withdrawal amounts supported by a guaranteed portfolio to an unguaranteed portfolio that attempts to replicate the same guaranteed payouts for as long as possible.)
In addition to minding the underlying assumptions, we must also be clear about what sorts of outcome measures are most appropriate. Clients who view a guarantee rider as an insurance product may consider the guarantee to be primarily a form of downside risk protection, in which case any analysis should focus on the worst-case outcomes. (This is the approach I took in parts 1 and 2.) But another justification for income guarantees that they encourage a client to choose a more-aggressive asset allocation with higher upside potential, in which case the focus may shift to demonstrating which approach enjoys superior average outcomes.
Data and modeling approach
Advisors who are familiar and comfortable with the 4% safe withdrawal rate rule-of-thumb may see little need for an income guarantee. But market conditions today suggest that pessimism may be in order – what worked for yesterday’s retirees may not work for today’s or tomorrow’s. Interest rates are at historical lows and stocks are overvalued, at least according to historically reliable metrics like Robert Shiller’s CAPE.
While parts 1 and 2 both analyzed outcomes for rolling periods from the historical data, as we turn to considering retirement income, the primary basis for this article will be the results derived from Monte Carlo simulation. Table 1, below, provides the asset market assumptions on which those simulations were based. For the most part, I used current market conditions to guide the simulations, but near the end of this article I’ll discuss how the results change under more optimistic assumptions. (For more detail on how I obtained the figures you see here, see Appendix 1 at the end of this article.)
Table 1
Asset Market Assumptions Based on Current Market Conditions
Arithmetic
Means
Geometric Means
Standard Deviations
Correlation Coefficients
Stocks
Bonds
Inflation
Stocks
4.8%
2.8%
20.0%
1
0.1
-0.2
Bonds
0.0%
-0.2%
7.0%
0.1
1
-0.6
Inflation
2.5%
2.4%
4.2%
-0.2
-0.6
1
Summary Statistics for U.S. Real Returns and Inflation Data, 1926 - 2011
Arithmetic
Means
Geometric Means
Standard Deviations
Correlation Coefficients
Stocks
Bonds
Inflation
Stocks
8.6%
6.5%
20.3%
1
0.1
-0.2
Bonds
2.6%
2.3%
6.8%
0.1
1
-0.6
Inflation
3.1%
3.0%
4.2%
-0.2
-0.6
1
My simulations assume a 65-year old couple who buys the guarantee at 65 and immediately begins to take income. For simplicity’s sake, their retirement date wealth is assumed to be $100, though the results are, of course, scalable. Since the analysis is assumes current market conditions, the payout rates at retirement for the 65-year old couple, until both spouses are deceased, are 4.5% for the VA/GLWB and 3.5% for RetireOne.
For the VA/GLWB, the payout depends only on age, while the payout rate for RetireOne as depends on the current yield on 10-year Treasury bonds. The payout rate is 3.5% if the Treasury yield is less than 4.5%, and it can increase to up to 5.5% if the Treasury yield exceeds 7%.
For RetireOne, after the guaranteed income begins, the benefit base is no longer determines the withdrawal amount. Instead, step-ups in withdrawals occur whenever the revised payout rate (a calculation that involves multiplying prevailing Treasury yields by the remaining account balance) exceeds the previous guaranteed withdrawal.
Since I do not attempt to simulate future interest rates, I’ve assumed that RetireOne’s payout stays at 3.5% throughout retirement. While that assumption could bias results somewhat against RetireOne, but any such effect is likely quite small, since interest rates are currently much less than 4.5% and, as we’ll see, it becomes increasingly unlikely for the portfolio to reach new high-water marks as retirement progresses.
When it comes to determining the value of a guarantee, it’s important to always consider whether an unguaranteed portfolio of mutual funds would be able to replicate the guaranteed payments without experiencing wealth depletion. As I explained above, the asset allocation for an unguaranteed portfolio in any such comparison should be less aggressive, though the exact allocations will depend on a client’s preferences.
The impact of costs
I assume that unguaranteed mutual funds have administrative costs of 0.2% annually, which matches the assumed costs for the funds in the RetireOne portfolio. The unguaranteed mutual funds benefit from not being charged the cost of the rider, which is 0.95% of the benefit base for the VA/GLWB (plus an annual fee of 0.59%, assessed on the contract value), and 1.35% of the contract value for RetireOne, when the asset allocation is 70% stocks and 30% bonds.
That’s an important difference to highlight: One of RetireOne’s significant advantages compared with the VA/GWLB is that its rider fees are assessed on the remaining contract value of the assets, as opposed to the high-water-mark total withdrawal base. When the value of remaining assets has fallen below its previous peak, that can mean substantial savings.
In order to isolate the impact of the differing bases to which the rider fee applies, I conducted simulations to compare hypothetical guarantee riders that share all of the same characteristics except for the rider percentage and the wealth to which it applies. For that test, I assumed every case would have a 70/30 asset allocation, a 4.5% payout rate, underlying account fees of 0.59%, and annual step ups. Compared with an annual rider of 0.95% assessed on the benefit base, I found that the percentage of the fee can approximately double, to 1.9%, if it is assessed on the current contract value instead. (I base that conclusion on the fact that, even with that doubling, the probabilities of wealth depletion over time match between the two types of fees.) RetireOne's rider fees depend on asset allocation, but they are certainly much less than double the VA/GLWB rider fee. What’s more, RetireOne's approach helps clients during bad luck scenarios because expenses will be reduced when the contract value falls below the benefit base.
Guaranteed income and the contract value of remaining assets
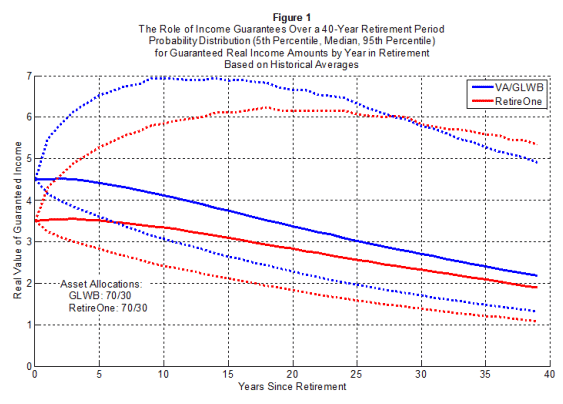
For starters, it’s important to recall that the income guarantees for both the VA/GLWB and RetireOne cannot be expected to keep pace with inflation. Figure 1, below, shows how the real value of income supported by each of these guarantees can be expected to decline throughout retirement. The distribution for the income path is shown for each guarantee in terms of its median (bold line) and the 5th and 95th percentiles (dotted lines) of the outcomes.
It’s not hard to see why both decline; for simulations based on current market conditions, inflation compounds on average at 2.4%. For the VA/GLWB, for instance, the average spending adjustment was only 0.68%. More surprising is the fact that the RetireOne payout is never the higher of the two, but this too makes sense if you consider the math. RetireOne provided 22.2% less income at the start of retirement (again, I’m assuming the lowest-possible 3.5% payout), and it was able to support average income increases of 1.06%. At that rate, it would take 68 years, on average, for the income from RetireOne to increase to the level of the income from the VA/GLWB.
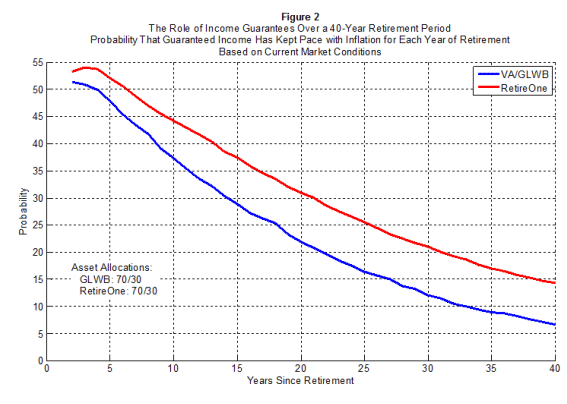
The key takeaway here, though, is that inflation considerations take a stark toll on both products. To further emphasize the lack of inflation adjustment, Figure 2, below, shows, by year of retirement, the probability that guaranteed income has kept pace with inflation. The steady decline in these probabilities over time can be clearly noted.
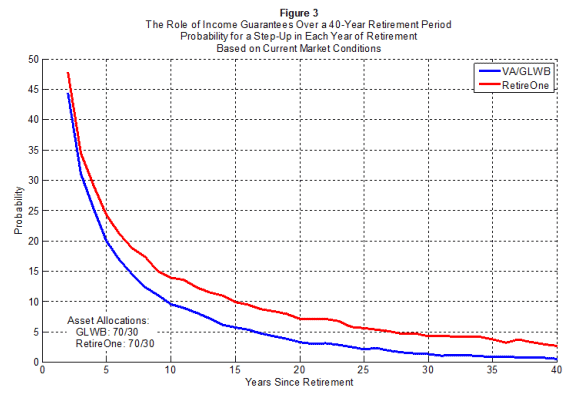
A big reason that guaranteed income almost always falls behind inflation is that, as retirement progresses, the probability that either income guarantee is able to provide a step up steadily declines. Figure 3, below, illustrates this trend. For instance, 10 years after retirement, the chances of a step up occurring are only 15% for RetireOne and 10% for the VA/GLWB. (Recall that it is easier for RetireOne to provide a step up, since it offers less income to begin with and so must clear a lower bar to achieve its first step up.)
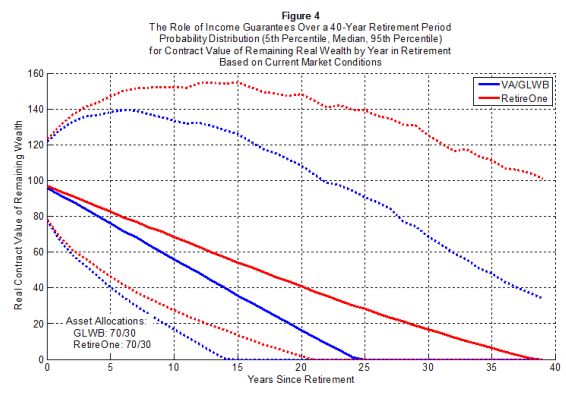
So the value of the payouts will almost certainly decline over time. What about the underlying assets? Figure 4, below, shows the distribution of the real value of remaining wealth over time. After 25 years, the contract value for the VA/GLWB falls to zero in more than half of the cases. But, again, although RetireOne preserves wealth better, that’s in part because it pays out less income.
Comparing income guarantees to unguaranteed mutual funds
Although the guarantees do not seem to be particularly adept at supporting inflation-adjusted income growth, other results make a much stronger case for the use of income guarantees in a retiree’s portfolio. With current market conditions guiding the simulations, the chances for depletion of an unguaranteed portfolio are real and meaningful, underscoring the value of an ironclad guarantee.
Tables 2 and 3, below, provide details about the distribution for remaining wealth 30 years into retirement for the VA/GLWB and RetireOne, respectively, as compared with the remaining wealth an investor can expect if they instead opt for unguaranteed portfolios of mutual funds that attempt to replicate the guaranteed payment stream using various stock allocations.
Table 2
Distribution of Remaining Wealth After 30 Years
for a VA/GLWB with a 70/30 Asset Allocation and
for Unguaranteed Mutual Funds Replicating the VA/GLWB Payouts (Various Allocations)
Based on Current Market Conditions
Stock Allocation
Mean
5th
%tile
25th
%tile
Median
75th
%tile
95th
%tile
Probability of Wealth Depletion
100%
117.2
0
0
32.4
125.3
521.9
33.1%
90%
90.6
0
0
29.9
106
389.2
31.9%
80%
68
0
0
26
85.2
276.5
31.2%
70%
48.9
0
0
21
65.8
191
31.0%
60%
33.1
0
0
15.7
48.6
124.8
32.2%
50%
20.3
0
0
9
31.2
75.3
36.3%
40%
11.3
0
0
2
17.5
46.5
46.2%
30%
6.4
0
0
0
8.4
32.5
58.9%
20%
4.1
0
0
0
3.1
23.8
69.3%
10%
2.9
0
0
0
0
19.2
76.7%
0%
2.4
0
0
0
0
17.2
81.4%
VA/GLWB 70/30
13.1
0
0
0
10.7
73.1
67.1%
Table 3
Distribution of Remaining Wealth After 30 Years
for a RetireOne Guaranteed Portfolio with a 70/30 Asset Allocation and
for Unguaranteed Mutual Funds Replicating the RetireOne Payouts (Various Allocations)
Based on Current Market Conditions
Stock Allocation
Mean
5th
%tile
25th
%tile
Median
75th
%tile
95th
%tile
Probability of Wealth Depletion
100%
158.1
0
12.7
67
180.5
633.8
16.8%
90%
128
0
16.3
62.9
155.5
484.3
14.9%
80%
102.2
0
17.6
57.9
129.6
362.9
12.5%
70%
80.1
0
18.6
52
106.1
259.2
10.2%
60%
61.4
0
18.2
45
85.3
181.3
8.5%
50%
45.5
0
16.8
36.6
64.1
119.7
7.2%
40%
32.3
0
12.8
27.5
45.7
82
8.6%
30%
22.4
0
6.1
18.2
32.9
61.2
15.3%
20%
16.1
0
0
11.2
25
51
26.7%
10%
12.1
0
0
5.5
19.2
44
38.9%
0%
9.5
0
0
0.4
14.7
40.6
49.3%
RetireOne 70/30
35
0
0
18.5
48.9
126.6
25.1%
The VA/GLWB, which supports the most guaranteed income, depletes its contract value after 30 years two-thirds of the time, with a mean remaining wealth of $13. With RetireOne, although it supports a lower income stream, the fact that the rider is based on the contract value helps on the downside. As a result, RetireOne leads to a lower failure rate and a higher expected wealth then does the VA/GLWB.
For unguaranteed portfolios, as the stock allocation increases, two things tend to happen. The probability of wealth depletion falls up to a certain point (70% stocks for the VA/GLWB, 50/50 for the RetireOne rider), and the average remaining wealth rises. A comparison of the two tables also shows clearly that unguaranteed mutual funds have an easier time replicating RetireOne’s lower payments. After 30 years, a 50% stock allocation minimizes failure at 7.2% when the goal is to match RetireOne’s payouts, whereas the minimum failure rate, achieved with a 70% stock allocation, is nearly a third (31.0%) for the VA/GLWB.
Both tables indicate that very low stock allocations perform quite poorly, so if that is the alternative a client is considering, then an income guarantee that eases the client into a more aggressive stock allocation will surely be worthwhile despite the additional cost. It’s a tougher decision with clients who can generally tolerate a more aggressive allocation.
The overwhelming story that these tables tell is that current market conditions create a complex investing environment for retirees, one in which the chances that the guarantee will be “in the money” (i.e., that an unguaranteed portfolio would have been depleted) are reasonably high.
These tables also illustrate the implications of the rider costs. In Table 2, we can see that the expected remaining real wealth for the VA/GLWB is $13.10, compared to $48.90 for the unguaranteed 70/30 portfolio. That difference of $35.80 represents the expected total compounded impact of the rider fees over 30 years.
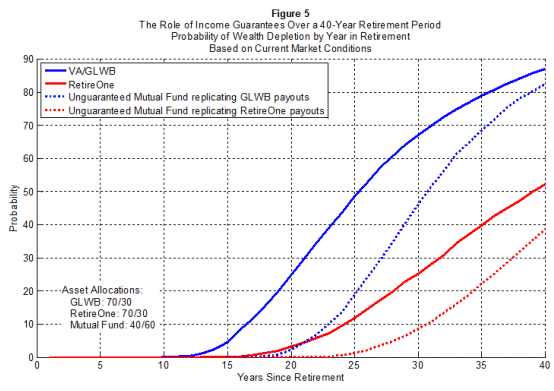
For a more nuanced perspective, consider Figure 5, which shows how the likelihood of wealth depletion evolves over time for each approach, both before and after the (admittedly somewhat arbitrary) 30-year mark. In this case, the results shown below reflect for a 70/30 allocation for the guaranteed approaches, and 40/60 for the unguaranteed approaches.
The impact of changing market returns to historical averages
Some readers may be concerned that my assumptions – based on current market conditions – are too pessimistic. To check the robustness of my results, I turned the situation around by considering a more optimistic, while still reasonable, assumption: that historical results, particularly higher stock and bond returns, will continue into the future.
With those new inputs, the guaranteed payout that I assumed climbed to 4.5% for RetireOne, in line with historical interest rates. In this case, that matches the payout for the VA/GLWB, reducing but not eliminating the distinctions between the two. Differences remaining between the two guarantees include the fact that VA/GLWB has a higher administrative fee (0.59% vs. 0.2%) and a rider of 0.95% on the benefit base, rather than a rider of 1.35% on the contract value for a 70/30 allocation.
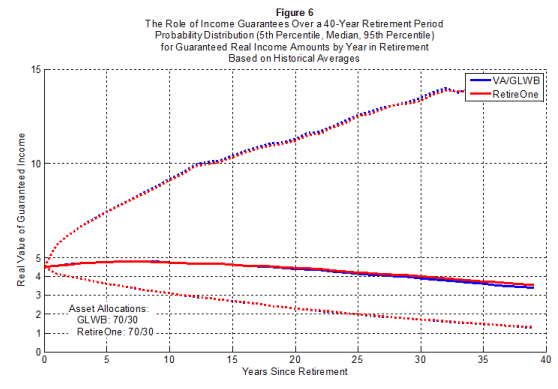
Under these new circumstances, inflation can be expected to compound, on average, at 3%, while the VA/GLWB provides 2.5% average growth and RetireOne provides 2.6% average growth. Figure 6, below, shows that the distributions of real income supported by the guarantees during retirement are very similar. In the median case, average real income actually shows a slight increase for the first ten years before beginning a gradual decline as step-ups become less likely. In the worst-case outcomes, the real values of income guarantees decline substantially.
Meanwhile, Table 4, below, shows the results after 30 years, comparing the RetireOne guarantees to unguaranteed portfolios, under the assumption that historical market averages will apply in the future. (The results for the VA/GLWB and RetireOne are very similar in this case, so one table will suffice.)
Table 4
Distribution of Remaining Wealth After 30 Years
for a RetireOne Guaranteed Portfolio with a 70/30 Asset Allocation and
for Unguaranteed Mutual Funds Replicating the RetireOne Payouts (Various Allocations)
Based on Historical Data Averages (1926-2011)
Stock Allocation
Mean
5th
%tile
25th
%tile
Median
75th
%tile
95th
%tile
Probability of Wealth Depletion
100%
454.4
0
85.1
230.9
532.9
1613.3
6.4%
90%
355.5
1.2
85.9
205.4
436.4
1185.6
4.9%
80%
273.2
8.7
84.4
179.9
347.5
835.4
3.6%
70%
205.2
15.5
79.8
153
270.4
567.8
2.5%
60%
149.1
19.8
71.5
122.9
198.8
367.6
1.9%
50%
103.1
19
57.2
92.2
135.7
221.4
1.4%
40%
67.3
0
35.1
61.1
91.3
152
5.6%
30%
44.2
0
11.2
37.6
67
116.5
18.4%
20%
30.6
0
0
20.9
49.7
98.4
33.8%
10%
22.5
0
0
5.2
36.8
86.7
46.5%
0%
17.2
0
0
0
26.4
78
56.4%
RetireOne 70/30
87.9
0
26.9
64
119.6
259.7
9.1%
Not surprisingly, everything performs better under this scenario than it did when we assumed the current, somewhat dreary market conditions. A client inclined to hold a 50/50 portfolio in this case may find little need for the guarantee, since the failure rate of such a portfolio is only 1.4%, and the expected wealth after 30 years matches the initial wealth in inflation-adjusted terms. However, the table above clearly shows that clients who are particularly nervous about the stock market and who would otherwise use a lower stock allocation could still benefit greatly from the guarantee if it persuaded them to switch to a higher stock allocation in the now-guaranteed portfolio.
Other options: partial annuitization or SPIAs with a cash refund
Of course, the options we’ve discussed are not the only way to obtain guaranteed income for retirement. Purchasing a fixed single-premium immediate annuity (SPIA) will generally enable retirees to obtain a guaranteed income source, and indeed it usually does so more cheaply. Financial planner Joe Tomlinson refers to GLWBs as a product of “actuaries gone wild,” focusing specifically on their complex combination of downside protection and upside potential. He may well have a point; for many investors, it may be more straightforward to address these important needs separately.
In early December, Kelli Huelier’s Income Solutions service indicated that our hypothetical 65-year-old couple can obtain a SPIA with 1% growth in income annually at payout rates of 4.86% for a joint and 100% survivor’s annuity. Under current market conditions, RetireOne also provided average income growth of about 1%.
As such, a couple on the cusp of retirement who are thinking about RetireOne could invest 72% of their assets in the SPIA and have a guaranteed income source with the same initial income amount and average growth rate. Doing so would provide downside protection (but not upside potential), since the income would continue to grow even when bad market conditions eliminate the possibility of step ups. At that point, the remaining 28% of assets could be invested as the client wishes, in order to obtain upside potential.
Another possibility is to purchase a joint, 100% survivor’s annuity with a cash refund option that will pay any unspent value of the principal to a beneficiary in the event of early death for both annuitants. As of early December, Income Solutions shows that a SPIA with annual 1% growth and a cash refund option is available with a payout rate of 4.8%. Combining that SPIA with an aggressive portfolio is another option, one that may more cheaply obtain the benefits of the income guarantees.
The bottom line
In part 1 of this series, I compared inflation-adjusted wealth accumulations over a 10-year period for a portfolio with the RetireOne guarantee and for an unguaranteed portfolio of mutual funds. I found that, historically, the guarantee generally would not have provided greater downside protection than an unguaranteed portfolio with a lower equity allocation would have. Instead, the guarantee offered the opportunity for greater upside potential when a client could be persuaded to use a higher equity allocation because the guarantee was in place. Clients still needed to be aware, however, the lack of inflation adjustments for the guaranteed benefit base weakens the downside protection.
In part 2, I compared a specific feature of the RetireOne guarantee with the Vanguard VA/GLWB at the moment when each calculate a guaranteed income amount. While the VA/GLWB payout rate is based only on age and whether the guarantee is for a single or a couple, the RetireOne guarantee is also based on the current 10-year Treasury yield, as we saw again here. I argued that this feature serves to reduce downside protection further, since lower wealth accumulations tend to be accompanied by lower interest rates (at least in real terms) and, therefore, by lower guaranteed payout rates.
Now, finally, we’ve seen how guaranteed income evolves throughout the retirement period. Although guaranteed income cannot generally be expected to keep pace with inflation, the guarantees could still deliver value to certain investors, especially clients who would otherwise be timid about investing aggressively in stocks. (Similarly, the guarantee could be valuable if it otherwise stops retirees from panicking and selling stocks after some future market drop.)
The risk of wealth depletion with an unguaranteed portfolio is real and meaningful. And clients must think carefully about to what extent they can stomach the reductions in lifestyle that might accompany complete wealth depletion if they choose to chance the unguaranteed approach.
Unfortunately, if they opt for the guarantee, it’s no panacea. The cost of the guarantee rider reduces the contract value of assets, which prevents clients from increasing their withdrawals to adjust for inflation later in retirement. So neither RetireOne nor the Vanguard VA/GLWB is a perfect solution.
But neither is worth writing off either.
Appendix 1: Monte Carlo Simulation Assumptions
In determining current market conditions, I based the standard deviations and correlation coefficients on historical data.
I calibrated the arithmetic mean for bond returns based on recent TIPS yields.
The arithmetic mean for inflation is the breakeven inflation rate implied by TIPS and Treasury yields.
The arithmetic mean for stock returns is calibrated to an equity premium of 4.8% above bond returns, which is the equity premium that prevailed in a GDP-weighted portfolio of 19 developed-market countries between 1900 and 2010, according to the Dimson, Marsh, and Staunton Global Returns Dataset, as provided by Morningstar and Ibbotson Associates.
Implicitly, this assumes lower future stock returns in the U.S. going forward, as the corresponding equity premium in the U.S. data was 6.2%.
Historical data calculations relied on Stocks, Bonds, Bills, and Inflation data provided by Morningstar and Ibbotson Associates.
I used the S&P 500 index to represent the stock market and intermediate-term U.S. government bonds to represent the bond market.
In all cases, returns were calculated on an annual basis, with withdrawals taken at the beginning of each year, fees taken at the end of each year, and annual rebalancing.
Wade Pfau, Ph.D., CFA, is an associate professor of economics at the National Graduate Institute for Policy Studies (GRIPS) in Tokyo, Japan. He maintains a blog about retirement planning research at wpfau.blogspot.com
Wade wishes to thank Bob Veres and Joseph Tomlinson, FSA, CFP®, for their continued support and advice about this article series, as well as David Jacobs for suggesting to look at SPIAs with cash refunds.