Advisors may be reluctant to recommend single-premium immediate annuities (SPIAs) with interest rates currently so low. It may be better to wait for rates to rise, which will bring more attractive SPIA pricing. But that leaves the question about how long we will wait for better pricing. In this article, I'll show how the decision to delay can turn out well or poorly, depending on the timing and size of rate increases.
Factors to consider
Deciding whether to buy a SPIA now or later is like the deciding when to refinance a mortgage – doing so requires making assumptions about an unknown future. The SPIA decision involves either explicitly or implicitly assuming answers to the following:
-
When will rate increases occur? This is closely related to the question of how long it will take the economy to recover enough that we get back to a more "normal" level of interest rates. Both "known unknowns" and "unknown unknowns," to borrow the Rumsfeld expressions, will determine the eventual timing.
-
How much will SPIA pricing rates change? These are the interest rates that insurers use in their pricing, and they reflect the rates they can earn on the corporate bonds and commercial mortgages that support their fixed-income products. Changes in these rates will reflect the combination of changes in Treasury rates and the spread over Treasury bonds that insurers can earn for taking credit risk.
-
How much interest does "parked" money earn? If one decides to delay buying a SPIA, money will need to be set aside to purchase it at a later time. The higher the returns on these funds, the less will be the penalty for waiting. Exposing those funds to too much volatility, however, might result in losses.
In order to demonstrate how these assumptions interact, I'll use a specific example.
A typical investor
This example is based on a 65-year-old woman who wishes to generate an additional $10,000 per year in secure income. She has decided to purchase a SPIA to provide the additional income, but needs to decide whether to make the purchase now or wait for higher rates.1
There are SPIAs that pay level amounts of income and also more costly versions that provide annual inflation adjustments similar to Social Security. In this example, I’ll use the level-pay SPIAs, which are by far the more popular option. Based on rates from Income Solutions®, a SPIA paying $10,000 per year in monthly installments would cost this individual $160,000.
For this particular example, I'll start by using my own subjective estimates for the assumptions mentioned above. Later, I will show how varying these assumptions will affect outcomes.
1. When making plans to generate additional retirement income, individuals and couples should first consider when to begin receiving Social Security benefits so that they build a base of optimized Social Security before planning for other income sources. The Society of Actuaries Decision Brief, "Deciding When to Claim Social Security," available here http://www.soa.org/research/research-projects/pension/research-managing-retirement-decisions.aspx provides a summary of the issues involved and lists references for more in-depth reading. This example assumes that such Social Security planning has been completed before considering SPIA
Increases in interest rates – If this individual makes the decision to wait to buy a SPIA, her plan will be to defer purchase until the economy gets back to "normal" – to feel some assurance that interest rates are in the vicinity of a plateau. I can more confidently predict this interest rate level than predicting when we will get there, so I'll address this assumption first.
The 10-year Treasury rate averaged 4.40% over the period 2003-2007 – the last time the economy gave the appearance of being in good health. The current rate is around 1.60% – a difference of 2.80%, which by itself would imply a 2.80% increase in the SPIA pricing rate when the economy recovers. However, corporate bond spreads are currently higher than they were between 2003 and 2007. The current BBB spread, according to data from the St. Louis Federal Reserve, is about 2.75%, but during 2003-2007 it got as low as 1%. I would expect some decrease in this spread if the economy improves, but not all the way back to 1%. Overall, my estimate for the increase in SPIA pricing rates, if and when the economy recovers, is 2%
Timing of the increases – Because the timing is so uncertain, rather than make a point prediction of when pricing interest rates will increase by 2%, what I have done instead is prepare a chart, below, that lays out how things would work out for this individual depending on when in the future the increase in rates occurs.
Parked money – If this individual decides to wait to purchase a SPIA, I'll assume that she places the $160,000 in safe, liquid investments that she can access at any time. While she is waiting, she will take monthly withdrawals from these funds of $833.33 ($10,000 per year). The safest investment choice would be money market funds that currently earn close to zero. I'll assume that she takes some risk and invests in short-term high-quality corporate bonds that currently earn 1%. Interest rates are increasing under the scenario I've assumed, so the average rate on parked money will exceed the initial rate, and I've assumed 1.50% for the average rate.
This is the table that puts these assumptions together.
SPIA Purchase – Impact of Waiting, 2% Increase in Interest Rates, |
|
1.50% Rate on Parked Funds |
|
|
|
|
SPIA Purchase Age |
Years of Waiting |
Current SPIA Payout Rate |
Payout Rate at Higher Interest Rate |
Balance at SPIA Purchase Age |
SPIA Income at Higher Payout Rate |
SPIA Income if No Rate Increase |
65 |
0 |
6.25% |
7.64% |
$160,000 |
$12,224 |
$10,000 |
66 |
1 |
6.37% |
7.76% |
$152,348 |
$11,822 |
$9,654 |
67 |
2 |
6.49% |
7.88% |
$144,579 |
$11,393 |
$9,283 |
68 |
3 |
6.67% |
8.07% |
$136,694 |
$11,031 |
$8,966 |
69 |
4 |
6.87% |
8.26% |
$128,690 |
$10,630 |
$8,638 |
70 |
5 |
7.02% |
8.46% |
$120,564 |
$10,200 |
$8,210 |
71 |
6 |
7.27% |
8.66% |
$112,316 |
$9,727 |
$7,857 |
72 |
7 |
7.56% |
8.95% |
$103,944 |
$9,303 |
$7,493 |
73 |
8 |
7.84% |
9.23% |
$95,444 |
$8,810 |
$7,061 |
74 |
9 |
8.13% |
9.52% |
$86,817 |
$8,265 |
$6,579 |
75 |
10 |
8.42% |
9.81% |
$78,059 |
$7,658 |
$6,037 |
To explain the numbers, let’s consider line in the table for age 72. This outcome assumes that the 65-year-old female waits seven years to purchase her SPIA, by which time SPIA pricing rates have increased by 2%. The Current SPIA Payout Rate of 7.56% for a 72-year-old comes from Income Solutions®. For the 2% interest rate increase, I estimated a payout rate of 8.95% using a SPIA pricing program that I wrote. The balance of $103,944 available to purchase a SPIA at age 72 came from taking monthly systematic withdrawals of $833.33 ($10,000 annually), with the remaining parked funds assumed to earn an interest rate of 1.50%. At an 8.95% payout rate, this individual would be able to use the $103,944 to purchase a SPIA paying $9,303, so she would lose out compared to having purchased a SPIA paying $10,000 at age 65. Even worse, if there were no increase in rates by age 72, and she decided to cut her losses and make the SPIA purchase anyway, her annual income would drop to $7,493.
With these particular assumptions, the break-even point for waiting is 5.4 years. The economy would need to improve enough to push pricing interest rates up by at least 2% within that timeframe for a decision to delay to beat purchasing the SPIA at age 65.
Sensitivity to assumptions
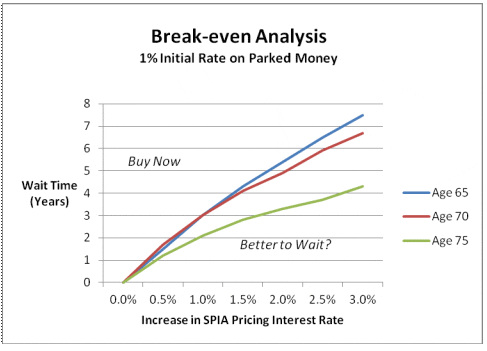
In this section, I'll provide two charts to show how the changes in assumptions for increases in SPIA pricing rates and rates earned on parked funds will affect the break-even durations. For the parked funds, I'll refer to an "initial" rate, and, in the modeling, this rate will adjust to reflect the assumed increase in SPIA rates. I've also extended the analysis to show how the age of the individual contemplating "purchase now" versus waiting will impact outcomes. This first chart uses the same 1% initial interest rate on parked money as in the example, but varies the change in the SPIA pricing rate.

The chart above can be read as follows. Scenarios in the upper-left are sending a definite signal to "buy now." For example, if it takes five years for the economy to recover and pricing interest rates only increase by 1%, the individual will suffer a loss of income by waiting the five years to purchase a SPIA. She would be better off making the purchase now. It might be expected that scenarios in the lower-right would be sending a clear signal to wait, but I've added a question mark. There is risk in waiting, because the individual is giving up the certainty of a $10,000 income for life. Rate increases are expected soon enough to generate more income by waiting, but that is not certain. And, for most individuals, losses in income weigh more heavily than gains, so the best choice will depend on an individual's flexibility to handle a possible loss in income.
I've shown these break-even curves at three different ages for an individual contemplating the "buy-now-or-wait" decision. The break-even periods are generally shorter higher ages. What is going on here is a contest between two rates: (1) the rate on parked money if the decision is made to wait, and (2) what I call "the SPIA owner's rate of return." This latter rate contains both a fixed-income component and the effect of mortality pooling, which increases with age as mortality rates increase. So the owner's rate of return is higher at higher ages.
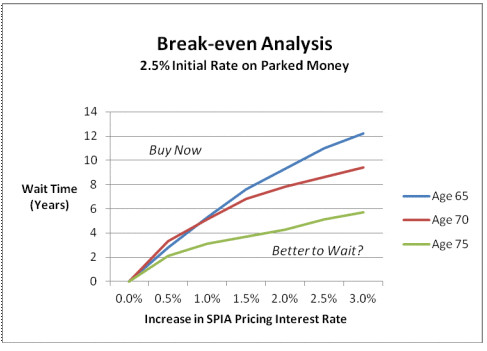
A higher rate on parked money
The chart below shows the effect of increasing the interest rate that parked money earns. If the individual happens to have a 401(k) plan with a stable value option, it may be feasible to use such funds for parked money. The current rate for one large-company 401(k) plan is 2.5%, so I show how the break-evens change at this higher initial rate.
Because there is less of a penalty for holding parked money, individuals can afford to wait longer, and the break-even durations increase. For instance, the 5.4-year break-even from the original example increases to 9.3 years when the parked money earns an initial 2.5%.
Conclusion
These charts are not intended to provide precise recommendations about whether to delay SPIA purchases. Such recommendations inevitably involve some guesswork and assumptions. Instead, this information provides a tool that to help advisors turn their own assumptions about the economy and interest rates into a plan, thus eliminating some of the guesswork that accompanies recommendations about SPIAs.
Joe Tomlinson is an actuary and a financial planner and is managing director of Tomlinson Financial Planning, LLC in Greenville, Maine. His practice focuses on retirement planning. He also does research and writing on financial planning and investment topics. He wishes to thank Michael Edesess and Dick Purcell for helpful suggestions.
Read more articles by Joe Tomlinson