One would think that an asset class yielding 7% and carrying less volatility than do equities would be popular with investors. Yet, despite those attributes, master limited partnerships (MLPs) remain unknown or ignored by large numbers of investors. The case for MLPs is compelling, so it’s time for a deep examination of the special properties of this asset class.
MLPs are publicly-traded limited partnerships that own and operate energy infrastructure assets, such as pipelines and storage facilities. The companies in this space offer a wide range of services, including the transportation, storage, gathering, processing and marketing of natural gas, oil, and other energy commodities.
Many prominent authors, including William Bernstein (The Four Pillars of Investing), Christopher Jones (The Intelligent Portfolio) and Burton Malkiel (A Random Walk Down Wall Street) do not mention MLPs in their classic works. But my own research, which I shared in October of 2010 and again in August of 2011, has argued for a meaningful allocation to MLPs. Aiming to construct portfolios that provide maximum yield at modest levels of risk, I found that a 15% allocation to MLPs was ideal.
Let’s explore the basic features of MLPs and examine the reasons investors and advisors should consider MLPs among the core asset classes needed to build complete and effective portfolios.
What are MLPs?
While MLPs are listed on exchanges, owning a unit of an MLP is different from owning a share in a public corporation – units in an MLP have a different tax treatment, which I will discuss later on.
To understand MLPs, consider two specific examples that are typical of the class:
Kinder Morgan Energy Partners (KMP), one of the largest pipeline transport and energy storage firms in North America, delivers refined petroleum products through 8,400 miles of pipelines, natural gas through 16,200 miles of pipelines, and CO2 through 2,000 miles of pipelines. The company also manages eight oil fields and a number of terminals and storage facilities for natural gas and oil. In total, Kinder Morgan operates more than 38,000 miles of pipelines.
Enterprise Products Partners (EPD), another large MLP, operates 16,650 miles of pipelines for transporting natural gas liquids, as well as terminal and storage facilities with a capacity of 156 million barrels in usable storage. The company operates 20,200 miles of natural gas pipelines, along with natural gas storage facilities totaling 14 billion cubic feet. The company also operates 5,250 miles of onshore oil pipelines and storage facilities with a capacity of 12 million barrels. The company’s operations span most of the United States.
MLPs are not highly sensitive to the prices of the commodities for which they provide transport and storage, because the revenues of MLPs are based on the volume of the commodities they handle, using a “toll road” business model. Even with very low prices on natural gas in recent years, MLPs have been able to maintain high yields.
Asset class performance
MLPs are especially attractive for several reasons. In the current low-rate environment, MLPs offer high levels of income. J.P. Morgan reported that MLPs have generated 6-7% per year in yield, plus an average of 8% per year in capital appreciation, over the last 20 years.
MLPs have historically exhibited a low correlation between their returns and the returns of other major asset classes. For the period from January 2002 through December 2011, for example, Cushing, an asset management firm, found that the correlation between their MLP index and the S&P 500 was 0.49, and the correlation between their MLP index and an aggregate bond index was 0.62. The correlation of their MLP index to REITs is 0.35; to high-yield bonds, it is 0.24.
The performance of MLPs was exceptional over the 10-year period that ended in 2011. A recent analysis by Libby Toudouze of Cushing found that MLPs generated the highest risk-adjusted returns among major asset classes over the last 10 years.
The MLP sector is highly liquid; it has a total market cap of $325 billion across 11 sub-sectors and more than 100 companies, according to Toudouze.
Part of the reason that MLPs are getting so much attention is their performance over the last 10 years, during which time many asset classes have under-performed their historical averages. Going forward, however, a more solid rationale than past performance is necessary.
Analyzing MLPs
To better understand the behavior of MLPs, let’s examine some statistical measures. I have chosen to examine the 15 MLPs with the highest market capitalization in the Alerian MLP Index and at least 36 months of historical data. That index includes the top 50 MLPs by market capitalization. There is an ETF that is designed to track this index (AMLP), launched in late August of 2010, but its record is not long enough for me to feel confident examining its statistical properties.
The correlations between the returns of individual MLPs are often quite low, which helps to explain why a basket of MLPs can generate high risk-adjusted returns. Low correlation of returns mitigates risk, although individual MLP volatility varies. Some MLPs have exhibited fairly low volatility in recent years – at or below that of the S&P 500 – whereas others have trailing three-year volatility that is more than twice that of the S&P 500.
Pipelines and storage facilities are assets that can give an MLP advantages in locals markets and, in some cases, monopolistic pricing power. I have studied this issue previously in the case of utilities, and the same benefit holds true for MLPs.
The betas of MLPs with respect to the S&P 500 are quite low, comparable to those of high-yield bonds, as the table below shows. The availability of liquid options on MLPs is limited, but I have compiled data for at-the-money implied volatility of put options for the 15 MLPs examined here. Implied volatility is the risk implied by options prices. I focus specifically on the implied volatility from put options because put options protect against downside volatility.
Statistics of individual MLPs (3 years through March 2012)
Name |
Ticker |
Beta vs. S&P 500 |
Trailing 3-Year Volatility |
ATM Put Option Implied Volatility |
Yield (April 16) |
Enterprise Products Partners LP |
EPD |
0.76 |
18% |
24% |
5.0% |
Kinder Morgan Energy Partners LP |
KMP |
0.53 |
14% |
26% |
5.7% |
Williams Partners LP |
WPZ |
0.89 |
40% |
26% |
5.7% |
Plains All American Pipeline LP |
PAA |
0.67 |
18% |
22% |
5.3% |
Energy Transfer Partners LP |
ETP |
0.91 |
22% |
25% |
7.7% |
Energy Transfer Equity LP |
ETE |
0.81 |
25% |
32% |
6.5% |
Magellan Midstream Partners LP |
MMP |
0.53 |
16% |
20% |
4.6% |
Enbridge Energy Partners LP |
EEP |
0.78 |
23% |
22% |
6.9% |
Linn Energy LLC |
LINE |
0.90 |
24% |
28% |
7.3% |
El Paso Pipeline Partners LP |
EPB |
0.44 |
20% |
28% |
6.0% |
MarkWest Energy Partners LP |
MWE |
0.94 |
30% |
28% |
5.3% |
Buckeye Partners LP |
BPL |
0.46 |
15% |
26% |
7.4% |
Boardwalk Pipeline Partners LP |
BWP |
0.42 |
19% |
25% |
8.0% |
Regency Energy Partners LP |
RGP |
0.49 |
23% |
28% |
7.6% |
NuStar Energy LP |
NS |
0.78 |
18% |
25% |
7.6% |
Average of MLPs |
|
0.69 |
22% |
26% |
6.4% |
S&P 500 |
SPY |
1.00 |
16% |
22% |
1.9% |
High-Yield Bonds |
JNK |
0.64 |
13% |
20% |
7.4% |
Corporate Bonds |
LQD |
0.09 |
6% |
10% |
4.2% |
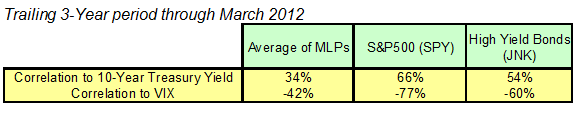
MLPs have a low positive correlation to interest rates, in part because many of the contractual obligations under which MLPs operate are inflation-adjusted. The table below shows the average correlation between 10-year Treasury yields and the MLPs listed above, as well as their correlations with the S&P 500 and high-yield bonds, for comparison.

MLPs also are less sensitive to changes in market volatility, as measured by the VIX index, than either the S&P 500 or high-yield bonds. While an increase in VIX has historically corresponded to poor returns from MLPs, the coupling between VIX and MLP returns is fairly weak. This defensive aspect of MLPs relates closely to their low beta with respect to the S&P 500.
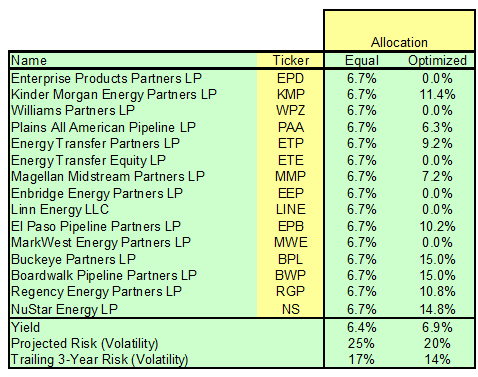
As noted above, one of the reasons that MLPs are getting increased attention is their high yields in an otherwise low-yield environment. In the chart below, I show the yield and risk levels of a portfolio that is equally weighted to the 15 MLPs from the previous example, as well as an alternative portfolio of MLPs that I designed to maximize yield for a projected volatility of 20%.
The implied volatility that I used to project risk for MLPs was that of the S&P 500 (22.5%), and the Monte Carlo model I used in the risk projections (Quantext Portfolio Planner) generated risk outlooks for the MLPs based on their historical risk levels, their correlations to the S&P500, and the implied volatility of the S&P500.
The equal-weighted portfolio of these MLPs has a yield of 6.4% and a projected volatility of 25%. In other words, it yields 6.4% for a portfolio with 11% more risk than the S&P 500. When I constructed a portfolio to achieve the maximum yield, which purposefully maximizes the benefits of lower correlations between MLPs, the resulting portfolio had a 6.9% yield and a projected volatility of 20% (which is just 89% of the volatility of the S&P 500).
Yield, trailing risk and projected risk for MLP portfolios (data through March 2012)
As we’ve already seen, one of the main attractions of MLPs is their low correlation to other high-yield asset classes. MLPs have fairly low correlations to high-yield bonds, an asset class with comparable yield. Similarly, MLPs have fairly low correlation to REITs. By combining MLPs with other high-yield asset classes, it is possible to create a portfolio with exceptional yield for its risk level. I have created an example below.
Sample high-yield portfolio (data through March 2012)
Name |
Ticker |
Allocation |
Enterprise Products Partners LP |
EPD |
2.2% |
Kinder Morgan Energy Partners LP |
KMP |
2.2% |
Williams Partners LP |
WPZ |
2.2% |
Plains All American Pipeline LP |
PAA |
2.2% |
Energy Transfer Partners LP |
ETP |
2.2% |
Energy Transfer Equity LP |
ETE |
2.2% |
Magellan Midstream Partners LP |
MMP |
2.2% |
Enbridge Energy Partners LP |
EEP |
2.2% |
Linn Energy LLC |
LINE |
2.2% |
El Paso Pipeline Partners LP |
EPB |
2.2% |
MarkWest Energy Partners LP |
MWE |
2.2% |
Buckeye Partners LP |
BPL |
2.2% |
Boardwalk Pipeline Partners LP |
BWP |
2.2% |
Regency Energy Partners LP |
RGP |
2.2% |
NuStar Energy LP |
NS |
2.2% |
SPDR Barclays High Yield Bond ETF |
JNK |
50.0% |
iShares FTSE NAREIT Mortgage REIT ETF |
REM |
15.0% |
PowerShares Emerging Market Sovereign Debt ETF |
PCY |
2.0% |
Yield |
|
7.6% |
Projected Risk (Volatility) |
|
15% |
Trailing 3-Year Risk (Volatility) |
|
13% |
I constructed a portfolio from MLPs and other asset classes, as a demonstration of how one might create a high-yield portfolio with a fairly modest risk level using MLPs:
- MLPs – 33%
- Mortgage REIT ETF (REM) – 15%
- Emerging-market bonds (PCY) – 2%
- High-yield bonds (JNK) – 50%
The resulting portfolio has a 7.6% yield, projected volatility of 15% per year, and trailing three-year volatility of 13%. This substantial boost in yield relative to risk (as compared to the MLP-only portfolio) owes mostly to the modest correlation between high-yield bonds and MLPs. The average correlation between the high-yield bond ETF and the individual MLPs in our list is 63%. The average correlation between REM, the mortgage REIT, and the individual MLPs is 39%.
The fact that it is possible to create a portfolio with a 7.6% yield and 13%-15% volatility influences the asset allocation process, particularly in a “new normal” environment when many forecast returns below 8% for equities. Investors seeking income can combine an allocation similar to this one with lower-risk fixed income to provide the most yield at an acceptable level of risk. Finally, having a satellite allocation to a high-yield sub-portfolio, such as the one above, can provide a baseline level of income.
The allocation to MLPs in a portfolio depends on an investor’s specific needs and risk tolerance. But, because MLPs have 7% yields and risk levels comparable to equities, they should have a role in investors’ asset allocations.
The projected volatilities for MLPs and other asset classes are higher, on a projected basis, than their current volatilities because long-dated options on the S&P 500 have higher implied volatility than the realized volatility in the market over the past three years.
Tax considerations
One impediment to increased adoption of MLPs is their tax properties. MLPs are pass-through entities, and the shareholders are limited partners and receive a share of corporate income without taxation at the corporate level. Investors in MLPs have to file form K-1 to pay taxes on their distributions from an MLP. The National Association of Publicly Traded Partnerships (NAPTP) provides a useful overview of the tax considerations associated with MLPs.
One unusual feature of MLPs is that part of the realized gain on an investment is taxed as capital gains, while part is taxed as ordinary income. The NAPTP explains the two components of gains that are taxed as ordinary income:
- The gain resulting from basis reductions due to depreciation (referred to as “recapture”)
- The gain attributable to your share of certain assets held by the MLP – substantially appreciated inventory and unrealized receivables
There is also a complication in terms of taxation for investors who hold MLPs within a tax-deferred retirement account such as a 401(k) or IRA, but that is beyond the scope of this article.
For advisors and investors who are leery of the extra work to file K-1s, one alternative is to purchase shares in a mutual fund or ETF that holds MLPs. By holding fund shares, investors only need to file 1099s. There are a number of funds that focus on MLPs, and SteelPath and Cushing are the two largest mutual fund managers in this space. The Alerian MLP fund (AMLP) is an ETF that is designed to track the Alerian MLP Index. The simplified tax treatment comes at a cost, however: The Wall Street Journal has noted that MLP funds substantially lagged the performance of their benchmark indexes, due to the increased tax expenses inherent in the fund structure.
MLPs and asset allocation
One strength of considering assets on the basis of risk versus yield, as I have done here, is that both metrics are directly observable and persistent. Average return is not persistent from year to year, but volatility and yield are. For example, this approach has resulted in a bullish perspective on high-yield bonds for quite some time that, in retrospect, was justified.
This analysis demonstrates that MLPs should feature prominently among the asset classes that can substantially boost portfolio yield without increasing risk. It also argues for using MLPs as a satellite holding (10%-20% of the total portfolio). MLPs have historically generated high risk-adjusted returns, and they currently provide high yields relative to their risk. In addition, the relatively modest correlation between MLPs and other major asset classes means MLPs can increase risk-adjusted returns when added to a portfolio that is primarily made up of traditional equity and fixed-income assets. In coming years, I fully expect that MLPs will be adopted as widely as other popular alternative asset classes, such as REITs and high-yield bonds.
A question remains as to why MLPs are not already more broadly used as a core component of strategic asset allocation. While I cannot offer any definitive conclusion, there are at least two possible explanations, in addition to the tax complexity discussed above. First, MLPs were launched in 1981, so they are relatively new as an asset class. Second, pension plans, because of their tax-exempt status, have a disincentive to invest in MLPs, because they risk being exposed to unrelated business income tax.
Some combination of these factors may be sufficient to deter certain investors, but many more stand to benefit if they become more familiar with these overlooked assets. The asset allocation benefits are so great that MLPs should thrive in the years ahead.
Geoff Considine is founder of Quantext and the developer of Quantext Portfolio Planner, a portfolio management tool. More information is available at www.quantext.com.
Geoff’s firm, Quantext is a strategic adviser to FOLIOfn,Inc. (www.foliofn.com), an innovative brokerage firm specializing in offering and trading portfolios for advisors and individual investors.
Read more articles by Geoff Considine