Advisor Perspectives welcomes guest contributions. The views presented here do not necessarily represent those of Advisor Perspectives.
Introduction
The recent financial crisis and high volatility environment caused many of us to reevaluate how we approach asset allocation. In many cases, portfolios designed for investors with a specific risk tolerance (e.g. a “moderate” investor) behaved as though they were intended for an entirely different, more aggressive investor. As we will show, the use of long-term volatility forecasts often yields static asset allocations that do not reflect current market conditions. As economic conditions change, so does the risk profile of a static portfolio, leading to an inevitable mismatch between the client’s risk tolerance and the risk profile of their portfolio.
How can advisors construct portfolios that meet their clients’ risk preferences across economic environments? You may be surprised to learn that tactical asset allocation has an important role to play. To understand why, let’s first consider how conventional thinking distorts the proper asset allocation for a hypothetical client, whom we will call “Susan.”
Let’s say that Susan, a successful, 50-year-old sales executive with $1 million in investable assets and a retirement timeframe of 15 years, was recently referred to you by one of your current clients. During your initial meeting with Susan, you ask her to complete a basic risk questionnaire. Instead of asking her to return to your office in a few weeks for an investment proposal, as some advisors may request, you ask Susan to swing by your office the following day for an additional meeting.
At the following day’s meeting, you ask Susan to complete another risk questionnaire, without telling her that it’s identical to the one she just completed. If you compared Susan’s responses to the two questionnaires, how similar do you expect her responses to be?
This, of course, is a rhetorical question. Unless Susan picked up a lottery ticket on her way home from your office and won the jackpot that evening, in all likelihood Susan’s responses to the two risk questionnaires would be the same.
Now, let’s take this scenario one step further. Exactly one month after Susan’s initial visit, you invite her back to your office and have her retake the same risk-tolerance questionnaire. Again, what are the chances that Susan will provide the same answers?
Chances are, after six months or even a year, Susan, like most clients, will provide similar responses. Clients generally have very stable risk tolerances.
This is an important observation and one that most approaches to asset allocation don’t address. An asset allocation built for Susan today and not adjusted over time will almost certainly become too aggressive or too conservative as capital market conditions evolve. Capital market conditions change significantly faster than investor risk tolerances.
For this reason we believe that advisors should employ tactical asset allocation — not to make risky bets on future expected returns, but to maintain a stable risk profile that matches the client’s risk tolerance in all market environments.
Are moderate portfolios really moderate?
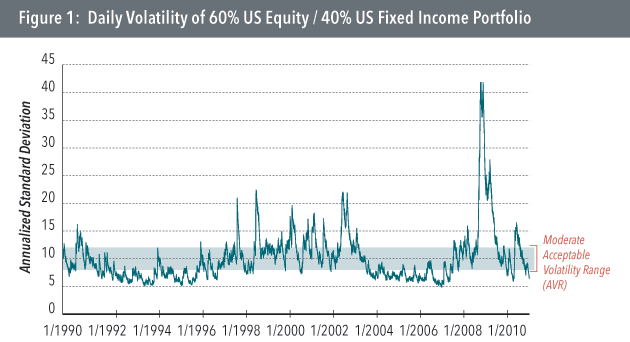
What is a “moderate” risk portfolio? The first portfolio that most often comes to mind is the 60/40 portfolio: 60 percent stocks and 40 percent bonds. As a reference point, the annualized volatility of a 60 percent S&P 500, 40 percent Barclays Aggregate portfolio was 10.01 percent from 1976 through 2010.
Let’s extend our example with Susan further, and say that the results of her completed risk-tolerance questionnaire suggest that she is a “moderate” investor. Furthermore, let’s define a moderate risk tolerance as one capable of handling volatility between 8 percent and 12 percent — a range around the long-term volatility of the 60/40 portfolio.
Now, since Susan is a moderate investor, we want the volatility of her portfolio to stay within a range of 8 percent to 12 percent ; anything over 12 percent is too aggressive for Susan and anything less than 8 percent is too conservative.

Had we invested Susan’s retirement assets on January 2, 1990, in the 60/40 portfolio, the one we’ve all been trained to believe is appropriate for a moderate investor, and periodically rebalanced, Susan would have experienced several periods of great discomfort. Over 20 percent of the time, the portfolio exhibited volatility levels in excess of 12 percent. Furthermore, Susan’s portfolio would have been too conservative over 38 percent of the time—a time that encompasses the stable economic conditions of 1992-1993 and 2004-2006.
While nearly all advisors use asset allocation models that are more sophisticated than a simple 60/40 portfolio, traditional approaches to asset allocation often produce static allocations, and thus highly variable risk profiles. In our experience, it’s both the use of long-term capital market volatility forecasts and infrequent portfolio adjustments that lead to static allocations and uncomfortable clients during periods of heighted economic volatility.
The perils of long-term volatility forecasts
How do your clients experience market volatility? Do you sit down with them once every five years, review the value of their portfolio, and explain how the portfolio has moved over the past five years? Or do your clients watch the news and the markets, calling you when they’re concerned about the economy or fluctuations in their account? In this digital age, chances are your clients watch the value of their accounts and feel volatility when the market moves – especially when it moves in the wrong direction.
Expected volatility is a required input in most asset allocation models, which prompts the next question: How do you forecast future volatility? Perhaps, like most advisors, you take the past five or 10 years of historical monthly returns for a group of indices, calculate the trailing volatility, and use that as your forecast. While these forecasts may be appropriate for the client who takes five-year trips to Antarctica without access to their account information, unfortunately they do little to help you manage the short-term volatility of your clients’ portfolios.
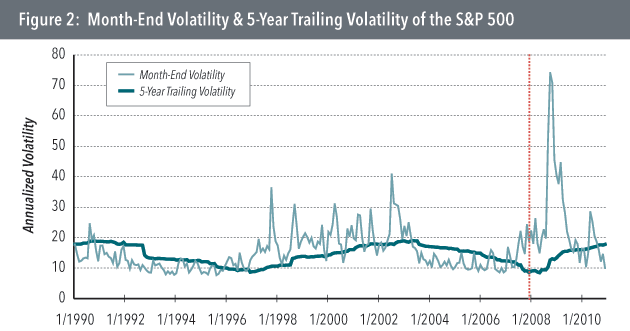
So let’s return to Susan and see what happens when we attempt to manage the volatility of her portfolio using five years of trailing monthly returns to forecast future volatility – a common practice among advisors. The following graph plots the 60-month rolling volatility of the S&P 500 against the estimated daily volatility of the S&P 500 at month-end.
Let’s assume that you plan to invest Susan’s portfolio on the first business day of January 2008 (marked by the dotted line above). To build Susan’s asset allocation, you need to forecast the future volatility of U.S. equities, so you gather returns on the S&P 500 and evaluate two different options for your volatility forecast:
Option A: Use the past five years of monthly returns to calculate the historical volatility, which turns out to be 8.6 percent.
Option B: Use a volatility model to calculate the volatility of the S&P 500 as of 12/31/2007, which turns out to be 18.9 percent.
Which of these values would you have used? Of course, hindsight is always 20/20, but wouldn’t the 18.9 percent forecast have seemed more appropriate back then? At the end of June 2007, the CBOE VIX was at 16; by the end of September it had risen to 18; and at the end of December it was 23. Market volatility was rising.
During this same timeframe, however, the five-year trailing volatility was heading lower, because as the estimation window moved forward, it dropped returns that had occurred during high-volatility months of the early 2000s and added returns from the low-volatility mid-2000s. Should data from five years ago drive your volatility forecasts?
It turns out that 5-year trailing volatility estimates are poor predictors of future volatility. Furthermore, they change very little from month to month, leading to static allocations that are often inconsistent with the prevailing economic conditions and, consequently, with the client’s risk tolerance. As we will discuss later, advisors should instead focus on two requisite inputs needed to manage the risk profile of a client’s portfolio: short-term forecasts of capital market volatility and correlations.
Are your clients compensated for high volatility?
While the previous section covered volatility forecasting, it did not address return forecasting, which is another key input in most asset allocation models. As an advisor, you may use a number of return-forecasting models, among them economist forecasts, average historical returns, and equilibrium expectations (e.g., the Black-Litterman Model).
But what happens to your return forecasts when market volatility increases and is expected to persist? Let’s say that your forecast for U.S. equity returns for the next three years is 6 percent per annum, and market volatility at the time of your forecast is 14 percent. With a risk-free rate of 3 percent, the expected Sharpe ratio is 0.21.
Now let’s assume that market volatility suddenly increases to 20 percent. What’s the net impact?
From the prior sections, we know that your clients’ portfolios are now more volatile and therefore may be inconsistent with their risk profiles. More specifically, what happens to your return forecast? Do you automatically increase it just because volatility is higher?
To most of us, it doesn’t make intuitive sense to increase expected returns just because volatility has increased. If we believe U.S. equity volatility is going to increase over the next month, but our forecast of future returns remains unchanged, our expected Sharpe ratio for U.S. equities declines from 0.21 to 0.15. We’re no longer expected to be compensated as well for taking U.S. equity risk.
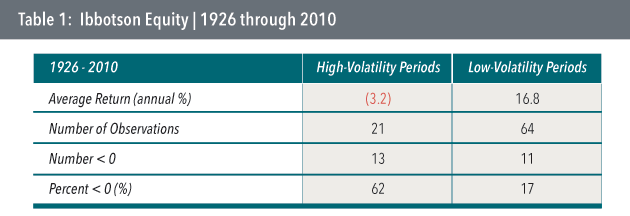
This hypothetical scenario is supported by historical data. To analyze the impact of high-volatility environments on U.S. equity returns, we’ve broken the returns of the S&P 500 into high-volatility years and low-volatility years, relative to the average volatility for the full timeframe.
While there are no guarantees that the past will repeat itself, historically investors have not benefited from taking risk when market volatility has been high. The average return of the S&P 500 during high-volatility years has been -3.2 percent, while the average return during low-volatility years has been +16.8 percent. Not surprisingly, 62 percent of the high-volatility years generated negative returns, while only 17 percent of the low-volatility years generated negative returns.
Not only does increasing volatility affect the risk profile of a client’s asset allocation, it often results in much poorer ex-post Sharpe ratios. Advisors can, however, manage a client’s risk profile and pursue stronger risk-adjusted returns by managing short-term volatility.
Implementing short-term volatility management
Thus far, we’ve shown that strategic allocations with static weights have time-varying risk profiles; that long-term estimates of future volatility are poor predictors of short-term volatility; and that during past times of market stress, increases in market volatility were associated with lower return-to-risk payoffs. How can advisors manage short-term volatility in their clients’ portfolios to alleviate these problems?
While an in-depth discussion of available tools is outside the scope of this article, we believe that advisors should focus their research efforts on the following two areas:
Short-term volatility forecasting: Exponentially weighted moving average models (EWMA), made popular by JP Morgan’s RiskMetrics group, have been popular for years and are a logical first step for those moving from long-term volatility forecasts to short-term forecasts. This model can also be extended to forecast short-term correlations. For those equipped to deal with additional complexity, we recommend reviewing Tsay’s Analysis of Financial Time Series for an introduction to more advanced volatility models (e.g., GARCH models and their multivariate extensions, as well as stochastic volatility models).
Portfolio construction: Capital market volatility can change dramatically from month to month. To adjust the portfolio for changing levels of market volatility, we recommend a monthly updating procedure that brings the expected volatility of the client’s portfolio into a range that is appropriate for his or her risk tolerance. By definition, a less-frequent rebalancing schedule will cause the portfolio to behave more like a static, strategic allocation. To limit transaction charges and tax costs, we recommend limiting the amount of turnover per month to an acceptable level.
Concluding remarks
For decades, we’ve been told that asset allocation explains over 90 percent of the variation in returns and that, above all else, we should focus our time and effort on building an appropriate strategic allocation for clients. Instead of focusing on long-term forecasts of the capital markets, however, we believe advisors should focus on short-term volatility management and reposition client portfolios with much greater frequency as capital-market volatility changes. In the end, accounting for short-term volatility in a client portfolio may help clients stick to the plan they develop with their advisor and enhance their satisfaction with the investment experience.
James Colon is a portfolio manager and senior quantitative analyst at Chicago-based Nuveen HydePark Group, LLC, where he specializes in asset allocation and statistical risk management. Mr. Colon can be reached at .
John Gambla is co-chief investment officer of Chicago-based Nuveen HydePark Group, LLC, a quantitative investment manager with $1.4B under management (12/31/2010). Mr. Gambla can be reached at .
Rob Guttschow is co-chief investment officer of Chicago-based Nuveen HydePark Group, LLC, a quantitative investment manager with $1.4B under management (12/31/2010). Rob Guttschow can be reached at .
To learn more about Nuveen HydePark, please visit www.hydepk.com.
Read more articles by James Colon, John Gambla and Rob Guttschow