Advisor Perspectives welcomes guest contributions. The views presented here do not necessarily represent those of Advisor Perspectives.
Summary
- European equities seem much cheaper than in the US. Europe trades at a 26% Price to Book discount and a 20% Price to Cash Earnings discount to the US. Some European industries and stocks are deservedly cheap and value traps; other industries and stocks are attractive and will benefit from global growth in exports and other macro trends.
- Shorter term pressure and or volatility will continue to haunt the euro and European equities over the next 12-18 months. It could take several quarters (or longer) for market participants to reward select European stocks as value plays and not value traps. A range of quality stocks in Europe have attractive risk/return profiles over the next 3-5 years, with the likely exception of banks.
- The sovereign debt problems that began in the Club Med countries are far from under control, and the situation in Europe may get worse before it gets better. The UK, US and Japan will eventually experience sovereign debt and fiscal problems unless their governments undertake major policy changes.
- Europe is highly integrated with global trade. Germany, whose export market is 30% larger than that of the US, is still the largest net exporter globally by a wide margin. A weaker euro will benefit a range of export oriented companies in Europe. In fact, German exports accelerated in March to a 23.3% growth rate (year-over-year), the highest in 18 years. The weak euro tailwind will likely have a positive impact on automakers (the largest export industry in Europe), industrials/capital goods, consumer goods and food/beverage companies. A weaker euro will hurt many US exporting industries selling into Asia and emerging markets.
Equity valuation

We may sound like a broken record, but European markets continue to appear more attractive on a valuation basis than other regions and historical averages (see nearby table). As of May 24th, Europe was trading at a 29% P/B discount and a 20% P/CE (price to cash earnings) discount to the US. Europe had a 75% higher dividend yield than the US.
Alternatively, the US was trading at a 35% P/B premium and a 13% P/CE premium to the rest of the world. Emerging markets, which have the highest growth profile globally, were only trading at a 10% P/B premium and a mere 1% P/CE premium to the developed world!
The chart below from Morgan Stanley shows a historical perspective on European valuations vs. US. Since 1975, Europe has historically traded at a discount of up to 40% to the US (based on Morgan Stanley’s blended calculation of P/B, P/CE and dividend yield). The current blended discount is more than 30%, which is close to trough levels seen in the late 1970s, 1993 and 2003. The light blue line in the chart (data since 1995) adjusts for sector weighting differences between the two regions (e.g. high tech in the US, higher telecom in Europe). On this basis, Europe’s discount is slightly greater than the median 15 year discount to the US.
A more compelling comparison is the Shiller P/E, which shows a much more favorable valuation for Europe than the US (see charts below from Morgan Stanley). The Shiller P/E is a value oriented, cyclically adjusted valuation metric, representing a 10-year historical average earnings figure. The European Shiller P/E recently traded at a 30% discount to that of the US (S&P 500).
Unfortunately, valuation matters more in the long-term, while macro sentiment and earnings results often drive shorter term price movements. It could take several quarters (or longer) for market participants to reward select European stocks as value plays and not value traps. In the first quarter, we indicated that in the short-term, US equities seemed likely to outperform Europe due to improving recovery prospects in the US (despite political turmoil and trillion dollar deficits).
US equities continue to outperform European equities. During the sharp three week decline that started on April 15th, US stocks declined roughly half as much as Europe (on a US dollar basis), with the strong dollar playing a big role.
Equity market trends
YTD through May 19th, while the MSCI Europe index is down 16%, the MSCI Europe in local terms is down 4.1% and the S&P 500 is actually slightly positive (+0.8%). The euro (at $1.24) is down 13.4% YTD, down 22% from its July 2008 peak, and now below the lows from November 2008. Euro weakness continues vs. the US dollar because of relatively slower economic recovery in Europe and low confidence levels in the Eurozone’s ability to solve the fiscal problems in its more sunny regions.
The bubble charts below show the YTD performance through May 19th for various MSCI indexes. The top chart shows the six largest countries in the MSCI ACWI. The bottom chart shows all other countries. Note the size of each bubble represents the size in the index. The equity markets in Japan and the US are the current “safe havens” while the largest European markets are lagging (again, mostly due to currency).
In the bottom chart, countries in each of the three regions (Greater Europe, Asia and Latin America) are color coded. Selected Asian and Nordic region countries are leading performance. Surprisingly Thailand is up almost 10% YTD, despite the domestic violence and political turmoil in that country! Greece is the laggard, down almost 40% in US dollar returns, with Spain, Italy and Portugal all down over 25%.
Source: Bloomberg, MSCI
Sovereign debt crisis
It has become clear that the fiscal condition within the Club Med Countries (Greece, Italy, Spain and Portugal) and Ireland are in various states of disarray. Greece is the most alarming, though it is just the tip of the iceberg. From the chart below (Figure 6 from Barclay’s Capital), Greece has the “worst” combination of budget deficit and government debt as a percentage of GDP. Italy has high debt but a low deficit, while Spain has low debt but a high deficit. The bar chart (Figure 7) shows estimates of the very high levels of fiscal “adjustments” needed to reduce debt to more “reasonable” levels. The bubble chart (Figure 10) shows those adjustment sizes in context to other historical fiscal crises in Europe from the last 30 years. Unfortunately, Greece has no comparable in history; Spain, Portugal and Ireland have similar adjustments needed as Sweden did in the mid 1990s. Italy, with a much smaller adjustment needed, is comparable to, well, Italy in 1985-1997 (sadly, the longest adjustment period historically).
Source: Barclay's Capital
Currency declines and ECB support package
When global equities peaked on April 15th, the euro closed at $1.36. By the day of the “crash of 2:45” in the US market (May 6th), the euro had fallen to $1.26. A 7% currency decline over three weeks is a rare event in currency markets (at least in developed markets). Not only was the euro slipping, but sovereign spreads were widening and equity market volatility was spiking back toward crisis levels. In response, the ECB and other government officials stayed up long past their normal bedtimes on Sunday, May 9th to come up with something to “shock and awe” market participants – some way of saying don’t mess with Europe or the euro.
The result was an emergency fund with a commitment for loans and reserves of close to $1 trillion (€750bn). A short lived relief rally in global equities over the next week was followed by renewed concern over the crisis and a continuing fall in the euro. The package is not an immediate panacea, however – Greece has a long road ahead to prove it is worthy of being in the EU, and the other Club Med countries also need to dramatically improve their fiscal imbalances over the next couple of years.
The euro has since fallen to $1.22 on May 18th (a four year low), which represents close to a 20% decline within six months of its $1.51 (recent) peak in November 2009. Many are simply losing confidence, and some currency strategists are calling for an alarming “return to par” – essentially another 20% decline to $1. The chart below highlights currency performance against the US dollar since the euro’s peak at $1.59 in mid-July 2008. The UK pound has fallen more than the euro (mostly due to a larger decline at the end of 2008), while the Swiss Franc has declined only half as much as the euro over that time. The Japanese yen has exhibited safe haven status, with a roughly 40% performance spread over the euro.
Source: Yahoo Finance
Global sovereign debt concerns
Investors globally are concerned, and not just about the Eurozone, but about sovereign debt in the UK, the US and Japan. The nearby table (Source: Economist, Feb 11, 2010) shows a multi-factor ranking of “sustainability of debt position” for most European countries plus US, Canada, Japan and Australia.
Eventually the US, UK and Japan will become much more problematic unless some dramatic fiscal and monetary policy changes are made.
Although the British pound has flirted with a 30% decline from the 2008 peak (as seen above), the UK’s longer term structure of its debt issuance has given the British government the longest average time to maturity - 13.7 years average. This is much longer than the US with a 4.8 year average.
On a positive note, areas of stability in Europe do exist. Switzerland and the Nordic countries have been relative safe havens, both fiscally and in equity markets. Sweden and Denmark are EU countries not using the euro, while Switzerland is outside the EU. Estonia is actually eager to join the euro, having just been approved for membership in 2011. Australia and Canada are also in better shape, as they are major commodity exporters.
European trade
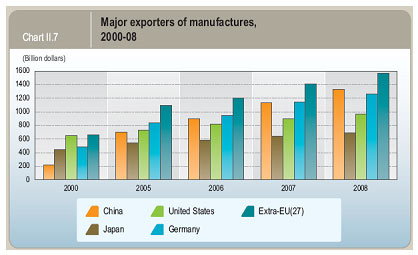
How important is Europe to global growth and trade? Certainly China has stolen the show in the last decade: the new powerhouse expanded its manufacturing exports five-fold to surpass the size of exports from Japan and the US, and then to match that of Germany, the largest economy in Europe (see chart below). However, the global pie has grown significantly during that time, so Germany has almost tripled its exports and the broader EU has more than doubled exports. Notably, Germany’s export market is over 30% larger than that of the US and the EU’s export market is more than 60% larger.
Source: World Trade Organization
The charts below highlight both intra-regional trade and inter-regional trade flows for the three largest geographic regions. Europe (including EU countries, UK, Switzerland and nine other non-EU/non-euro countries) has more than double the “internal” trade compared to Asia (including Japan). For “external” trade though, Asia’s trade to Europe is almost double the imports received from Europe; Asia’s trade to US/Canada is more than double the imports received. The trade balances between US/Canada and Europe are fairly even.
Digging deeper into countries and industries is also instructive. The nearby charts highlights the top ten exporters, the top ten net exporters and the top five net importers. Germany and China are neck and neck as the largest exporters, with the US a close third.
Japan has obviously fallen in the rankings, but has experienced an acceleration in auto and technology exports (especially across Asia) and GDP growth over the past several quarters. Japanese exports rose 45% in March (compared to 2009); GDP rose 1.2% in the first quarter (the highest in over ten years)
The Netherlands is a dominant intra-Europe exporter, while France and Italy have competitive positions as luxury goods exporters to the world. Consumer wealth in Asia ex-Japan and the Middle East is a major driver of luxury goods growth globally. Finally, Russia is a dominant force in energy (i.e., oil and natural gas for Europe).
For NET exports, Germany ranks highest because its imports are relatively low, while China ranks lower because its imports (primarily in the materials and energy sectors) are relatively high. Russia and Saudi Arabia rank high because their imports are much smaller relative to their energy exports. The US and UK are lowest in the ranking as the largest net importers. This is a major cause of trade and other economic imbalances.
Industry Implications of a weak euro
Several export industries in Europe should benefit from a weaker euro going forward. In Germany, this includes automakers (largest export industry in Europe), industrials/capital goods and software companies. In France this includes transportation, pharmaceuticals, consumer goods and food/beverage companies. In Italy this includes automakers and consumer companies. Greek shipping companies should also benefit (over 15% of world shipping fleet).
Across Europe, industrials, technology/telecom equipment, software, food, construction and engineering companies exporting globally should benefit, as well as local tourism-oriented businesses, due to increased travelers coming from Asia (especially China) and the US. Exports to non-Euro countries (e.g., UK and Switzerland) could get a boost, though the pound and the Swiss franc tend to be fairly correlated to the Euro, though the Swiss have been intervening in the currency markets to maintain some strength.
On the other hand, due to the weak euro, some US exporting industries will be at a competitive disadvantage (vs. Europe) when selling into Asia and emerging markets. This includes machinery, technology, aircraft and medical device producers.
Not all US or other non-euro manufacturers will be hurt by the euro’s precipitous fall. Note that some larger non-euro manufacturers have already hedged their exposure to currency movements in Europe by housing their operations/plants in Europe. Thus, their only exposure would be from an accounting standpoint when their assets and revenues are translated into dollars at the end of the quarter, i.e. they have only “translational risk” to a fall in the euro. The companies’ underlying profits and book value, however, would remain unchanged. (In other words, the fluctuation in translational value would not be realized until the actual assets and revenues are sold or exchanged into US dollars).
Other non-euro companies hedge their exposure to currency movements by using forwards and other derivatives contracts, mitigating “transactional risk” – i.e. the risk of deterioration in the opposing currency for current and future transactions. Large companies generally hedge a large portion of “expected” export sales to avoid this type of exposure. Both of these hedging techniques will dampen some of the impact of a declining euro for large US exporters.
Note that since China’s currency is semi-pegged to the dollar, some export weakness could occur, though this is likely outweighed by the economy’s low cost manufacturing advantage.
Export and growth trends
Recent export trends in Europe have been favorable due to the global recovery. In Q1 2010, German exports rose 11.3% and French exports rose 5.2%. The figures for March showed that German exports accelerated to a 23.3% growth rate (year-over-year), the highest in 18 years. German GDP in Q1 rose 0.2% sequentially, above consensus estimates for negative growth, while French GDP rose 0.1% in Q1. According to JP Morgan, the PMI manufacturing indicator for Germany is now 61.5 and 57.6 for the Eurozone, indicating strong recovery trends. While Greece is a low 42.9 (contraction), Spain and Ireland are both close to 53 (slight expansion), despite unemployment of 20% and 13%, respectively.
In the Netherlands, the fifth largest exporter in the world, exports rose 11% in Q1; exports represent 70% of Dutch GDP. However, more than 80% are exported to other European countries, with agriculture and energy being the major export industries. GDP growth in the Netherlands was 0.2% in Q1. Italian GDP rose 0.6% in Q1 while exports rose 5.4% (3 months through February).
The table below highlights GDP and growth for the largest countries in the Eurozone according to the April 2010 IMF estimates (before the most recent sharp currency decline). Several Eurozone economies are struggling to recover. The IMF expects Greece, Spain and Ireland to have the slowest recoveries in the Eurozone. A 1% growth rate for the Eurozone is therefore highly dependent on having 1.2%-1.5% growth in Germany, France and the Netherlands – all large exporters. Importantly, the OECD estimates that a 10% decline in the euro would add 1.0% to GDP growth over a succeeding 12 month period.
European earnings growth
Earnings estimates for Europe are trending upward for 2010 and 2011 (see chart below). 2010 estimates are just below 2005 actual earnings, but could reach or exceed that level. 2011 are just above 2006 actual earnings. Peak (actual) earnings were in 2007, and 2012 estimates are just above that level (though it is too early to rely on those estimates at all). Overall for Europe, five years of earnings growth were essentially lost due to the global recession and financial crisis.
Source: Morgan Stanley
A weaker euro should soon help revenues (and profits) at European exporters. High quality companies in Germany, France, etc. – those that have been cutting costs and improving productivity over the past year - could have upside earnings growth surprises in the Q2 and Q3 reporting season (July and October). Patient money managers holding these stocks could be rewarded sooner rather than later. Ultimately, earnings drive stock price movements in the shorter-term just as much as macro sentiment. Both value managers and growth managers are starting to salivate at selected opportunities across Europe. Active managers have already focused their European exposure on companies benefitting from growth in Asia and Central/Eastern Europe to generate alpha.
Opinion
The situation in Europe may get worse over the next year or more before it gets better. Currency volatility will continue to remain high, and the euro could have some short-lived rallies resulting from potential government supportive actions and GDP revisions. Despite a sharp correction in the euro already this year, downside risk remains. Consider that the latest OECD estimates (from 2009) indicate that purchasing power parity for the euro is $1.17 (6% overvalued). Euro bears believe the euro should trade at parity to the dollar. Just as currencies can become overbought and overvalued (recall the euro at close to $1.60), they can also become oversold and undervalued - but in our opinion, the euro trading down to $1 seems like a stretch, unless the crisis deepens dramatically.
In spite of euro weakness, we’d like to highlight an interesting study by JP Morgan (see table below) that examines factors surrounding six major historical periods of European equity outperformance over the US (since the mid 1970s). When Europe outperformed, the euro (and pre-euro equivalent) was actually experiencing declines ranging from 2% to 30%. Further, in four of the six periods, European P/E discounts to the US ranged from 15% to 33%. Outperformance (even reflecting the negative currency headwind) ranged from 8% over 14 months to 100% over 65 months.
A weaker euro and discounted valuations may in fact be favorable for European equity outperformance – the historical study showed that monthly median outperformance of European equities was 1.3% (even on a US dollar basis)! We believe that a range of quality stocks in Europe have attractive risk/return profiles over the next 3-5 years, with the likely exception of banks.
Source JP Morgan
Dan Trosch is a Director with Fortigent, LLC, a Rockville, Maryland-based provider of wealth management solutions and consulting services to independent advisors, banks and trust companies.
All mutual fund performance figures are net of all fees and expenses and reflect the reinvestment of dividends and other income. The mutual fund returns are provided to Fortigent by one or more commercial databases. Equity and fixed income separate account manager returns are gross of all fees and reflect the reinvestment of dividends and other income.
This report is for illustrative purposes only. Past performance is not indicative of future results. The information contained in this report has been gathered from sources we believe to be reliable, but we do not guarantee the accuracy or completeness of such information, and we assume no liability for damages resulting from or arising out of the use of such information. The performance numbers displayed herein may have been adversely or favorably impacted by events and economic conditions that will not prevail in the future. The index is unmanaged and does not incur management fees, transaction costs or other expenses associated with investable products. It is not possible to directly invest in an index. All returns reflect the reinvestment of dividends and other income. Performance results do not reflect the separate advisory fee that may be charged by your investment advisor (for example, an advisory fee of 1% compounded over a 10-year period would reduce a 10% annual return to an 8.9% return).
Read more articles by Dan Trosch, CFA