Advisor Perspectives welcomes guest contributions. The views presented here do not necessarily represent those of Advisor Perspectives.
Sharp losses in the equities markets have wiped out billions of dollars of wealth. To their credit, investors haven’t started a panic-driven sell off, but many are definitely rethinking the structure of their portfolios. The natural reaction is to abandon riskier assets, regardless of price, and to head for the safety of cash. At times like these, advisors exhort their clients to stay the course by sticking with their long-range plan.
For many investors, particularly younger ones with many years of growth ahead of them, this is the best advice. The longer the investment horizon, the greater the opportunity to recoup losses and magnify gains on purchases made when financial assets are on sale, as they are now. The recent declines can actually work to the benefit of these long-term investors.
But what about the 50-year-old who plans to retire within the next decade? What about the 40-year-old who has just seen her wealth drop over 40% in one year? And what about the 30-year-old with a young family who just lost his job? Should any of them stay the course?
The issue is much more complicated than simple reactions to short-term losses. Instead, it involves investment time horizon, current and expected cash flows, and – most importantly – the investor’s comfort level given his or her newly diminished wealth. Isn’t it reasonable for investors’ objectives to change along with major fluctuations in their wealth? In these instances, sticking with the current portfolio may not be the best option – even for long-term investors. Advisors need a reliable way to determine when to stay the course and when to plot another.
Constant risk
Is it reasonable to assume investors are comfortable with the same level of risk regardless of their overall wealth? Many advisors do when helping clients set goals for the long term. Consider, for example, a 30-year old with investable assets of $100,000. After profiling him, the advisor suggests a 60/40 split between stocks and Treasury Bills. In this case, 60 percent of the portfolio is invested in risky assets. If stocks rise by an annualized 9.6%, and the Bills grow by an annualized 3.7%,1 then at the end of the fourth year the portfolio ends the period as a 65/35 split and valued at $132,832. At this point, the advisor would rebalance back to the original mix by selling $6,876 from the stocks and buying a like amount of Treasury Bills. In a fluctuating market, this approach is effective because it leads to selling the more highly appreciated asset and buying the cheaper one. In essence, it forces the investor to buy low and sell high.
But it works against the investor in a down market. Consider 2008, when the total returns were -37% for the S&P 500 and +2% for 30-Day Treasury Bills. The portfolio’s value would have fallen from $100,000 to $78,436, leaving 48% in the S&P 500 and 52% in Treasury Bills. In order to balance back to the original 60/40 mix, the investor would have to shift $9,262 from Bills to stocks. As before, he is selling the appreciated asset and buying the cheaper one, but this time it’s against the backdrop of a 37% loss in the asset being purchased and a 22% loss in the overall portfolio. If this is the investor’s total wealth, he’s lost 22% in one year. If he has other assets, such as a home or a 401(k), he probably lost similar amounts there – or possibly more.
1 These are Ibbotson Associates’ historical returns for the S&P 500 (extended) and U.S. Treasury Bills for the period January 1926 – December 2008.
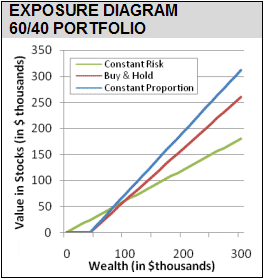
After seeing his wealth diminish this dramatically in one year, isn’t it reasonable that the investor’s risk and return objectives would change? While a 60/40 mix of stocks and Bills might have been appropriate when his investable assets were $100,000, is it still at $78,436? This might not be such an issue if the investor had started with $10 million or even $1 million, but it’s a greater concern at lower levels of wealth. Static allocation and periodic rebalancing assume the investor’s risk and return objectives remain unchanged at all levels of wealth, whether $10 million or $78,436 – or even as it approaches $0. The exposure to stocks relative to wealth is illustrated by the green line on the chart below.
Varying risk
For many investors, risk tolerance increases along with wealth. Conversely, as wealth declines, they become more risk averse. The traditional “buy-and-hold” approach reflects this risk profile. A buy-and-hold investor using the two-asset portfolio would decide on an initial allocation and then never rebalance regardless of what happens in the market. The strategy can be expressed in general terms as:
Stock Allocation = a x (Total Portfolio Value – Floor)
Where:
Floor =Allocation of Low-Risk Assets
a =Constant Multiplier

For the two-asset buy-and-hold investor, the multiplier is 1, making the stock allocation the difference between the total portfolio value and the allocation to Treasury Bills. This relationship will always hold regardless of how the two assets trade. In essence, they trade independently of one another; the Treasury Bills slowly but steadily grow while the stock portion fluctuates. Because there is no rebalancing, the portfolio value will never fall below the floor established by the Treasury Bills, regardless of what happens to the stock allocation. As wealth grows, so does exposure to the risky asset, and the opposite occurs as wealth declines to the floor level. The red line on the previous chart illustrates the stock exposure of the buy-and-hold strategy. Notice how wealth never goes to zero because the floor of Treasury Bills will always be there.
If the Constant Multiplier (a) is greater than one, a more aggressive investor can increase the proportion of the portfolio allocated to the risky asset at all levels of wealth above the floor. This turns the passive buy-and-hold strategy into an active one.2 In any event, the portfolio must be periodically rebalanced as the stock exposure changes. The blue line on the chart above illustrates the stock exposure when the Constant Multiplier is 1.2. As you can easily see, the stock exposure is higher at all levels of wealth above the floor relative to a simple buy-and-hold strategy.
2 At its extreme, if the Constant Multiplier is large and the total portfolio value is large enough, the formula may require leverage – a far cry from the traditional buy-and-hold approach. In the case illustrated here when the multiplier is 1.2, leverage is required at wealth levels over $240,000.
There are two major differences between the varying risk strategy and the constant-risk approach. First, as already suggested, the varying risk strategy has a floor below which the portfolio will never fall, while the constant-risk portfolio can approach zero. This additional margin of safety can be comforting to investors whose risk tolerance changes with wealth. A second difference stems from the fact that the varying risk strategy has no requirement to sell the appreciated asset and buy the laggard. Instead, the stock position will continue to grow as the market moves up and will decline as the market falls. As a result, the buy-and-hold strategy works best in a trending market.3
None of these strategies is inherently superior to the others. While most investors don’t think about it in such precise terms, many don’t maintain the same risk tolerance at all levels of wealth. As a result, it is reasonable for some investors to change their objectives as their wealth declines. The challenge for the advisor is to distinguish those who are simply experiencing an unthinking reaction to last year’s deep decline from those who now truly have different objectives. For the latter, staying the course is not the solution.
The right questions
Advisors often take new clients through a suitability and profiling process to determine and document their investing background, risk tolerance, and objectives. Based on this, they can then be assigned a specific asset allocation and their portfolio can be invested accordingly. Following 2008’s market declines, this portfolio may still be appropriate for investors with constant risk tolerances, but it probably isn’t for those whose risk tolerance varies with their wealth. It’s time to profile them again.
Recent losses may lead them to be too risk averse for the long-term. Just as they may have become too aggressive prior to 2008, they may be too defensive now. Furthermore, clients may have conflicting goals – they may expect high returns in up markets, few if any losses in down markets, high liquidity, and low risk. This is also a good time to have an open-ended discussion with them regarding the conflicts in their expectations. Ideally, the profiling process will help bring these issues to light and help resolve them.
The profiling process should distinguish between an investor’s goals and preferences for each objective. Goals are desired outcomes, such as getting an average annual return of at least 8% or avoiding annual losses of more than 10%. Priorities are the importance the investor places on each specific outcome. This distinction is important because goals can remain the same while priorities change. After 2008, an investor may still want an 8% average return over time, but now avoiding 10% losses in any given year is much more important to him. Arguably, clients’ preferences – the weights they place on their various expectations – are more likely to have changed over the past year than the quantitative expectations themselves. Both aspects are critical to a meaningful profiling process.4 Simple questionnaires that ask a few basic questions and then average the responses aren’t sufficient.
After 2008’s market turmoil, advisors shouldn’t be surprised to learn that many clients’ objectives have changed. It’s difficult to sustain a significant decline in wealth without reassessing long-term goals. It’s up to the advisor to help determine when clients truly need a different strategic portfolio and when it’s best to stay the course. A solid profiling process will support the determination.
3 For a more in-depth discussion and comparison of these strategies, see Pernold, André F. and William F. Sharpe, “Dynamic Strategies for Asset Allocation,” Financial Analysts Journal (January-February, 1995), pp. 149-160.
4 Klein Decisions’ K4 Portfolio Selection is an example of sophisticated yet easy to use software that combines client goals and preferences in the suitability and profiling process. For more information, go to www.kleindecisions.com or call 877.553.4634.
Read more articles by Ted A. Ponko, CFA