The BEA's Personal Income and Outlays report revealed inflation rose more than expected in March. Core PCE, the Fed's favored measure of inflation, was up 0.3% from February and was flat at 2.8% year-over-year. Inflation was expected to increase 0.3% month-over-month and cool to 2.6% year-over-year.
The latest headline PCE price index rose 0.3% month-over-month (MoM), as expected. On an annual basis, headline PCE accelerated to 2.7% in March, up from 2.5% in February and higher than the 2.6% forecast.
PCE Price Index
Personal consumption expenditures (PCE) measures and tracks changes for all domestic personal consumption. Core PCE measures the changes in personal consumption less food and energy, making it less volatile than the headline PCE. The PCE Price Index is calculated using PCE data and is a key way to measure changes in purchasing trends and inflation.
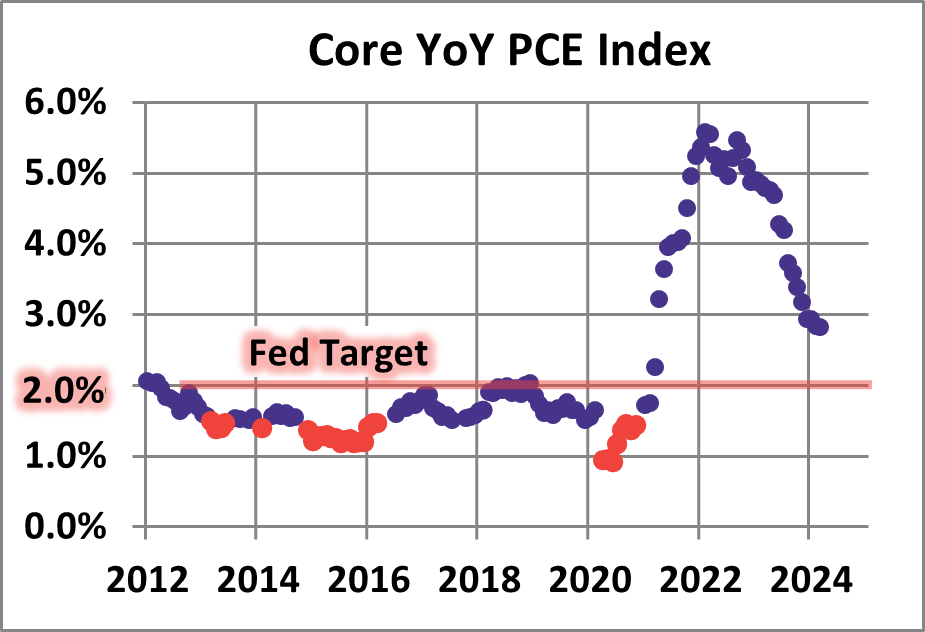
 The adjacent thumbnail gives us a close-up of the trend in YoY core PCE since January 2012. The first string of red data points highlights the 12 consecutive months when core PCE hovered in a narrow range around its interim low. The second string highlights the lower range from late 2014 through 2015. Core PCE shifted higher in 2016 with a decline in 2017, 2019, and 2020, with a major jump in 2022.
The first chart below shows the monthly year-over-year change in the personal consumption expenditures (PCE) price index since 2000, with a callout showing the last 12 months. Also included is an overlay of the core PCE (less food and energy) price index, which is Fed's preferred indicator for gauging inflation. The 2% benchmark is the Fed's conventional target for core inflation. Headline PCE accelerated for a second consecutive month to 2.7% in March from 2.5% in February. Core PCE was flat in March, remaining at 2.8%.
For a long-term perspective, here are the same two metrics spanning five decades.
Another common measure of inflation is the Consumer Price Index. For an analysis on how these two inflationary measures stack up, check out our Two Measures of Inflation update.
For a closer look at the two main measures of inflation and how they stack up against each other, check out the video below.
Note: data is through January 2024.
Read more updates by Jen Nash
 The adjacent thumbnail gives us a close-up of the trend in YoY core PCE since January 2012. The first string of red data points highlights the 12 consecutive months when core PCE hovered in a narrow range around its interim low. The second string highlights the lower range from late 2014 through 2015. Core PCE shifted higher in 2016 with a decline in 2017, 2019, and 2020, with a major jump in 2022.


