Official recession calls are made by the National Bureau of Economic Research’s Business Cycle Dating Committee. The committee does not follow a fixed formula, but four indicators are generally believed to play an important role in identifying turning points in the business cycle:
- Nonfarm employment
- Industrial production
- Real retail sales
- Real personal income excluding transfer receipts
The Latest Indicator Data
Here is where each of the four indicators currently stands:
- Nonfarm employment is near an all-time high, based on data through July 2026.
- Industrial production is 1.40% below its September 2018 all-time high, based on data through June 2026.
- Real retail sales are at an all-time high, based on data through June 2026.
- Real personal income excluding transfer receipts is 0.69% below its September 2025 all-time high, based on data through June 2026.
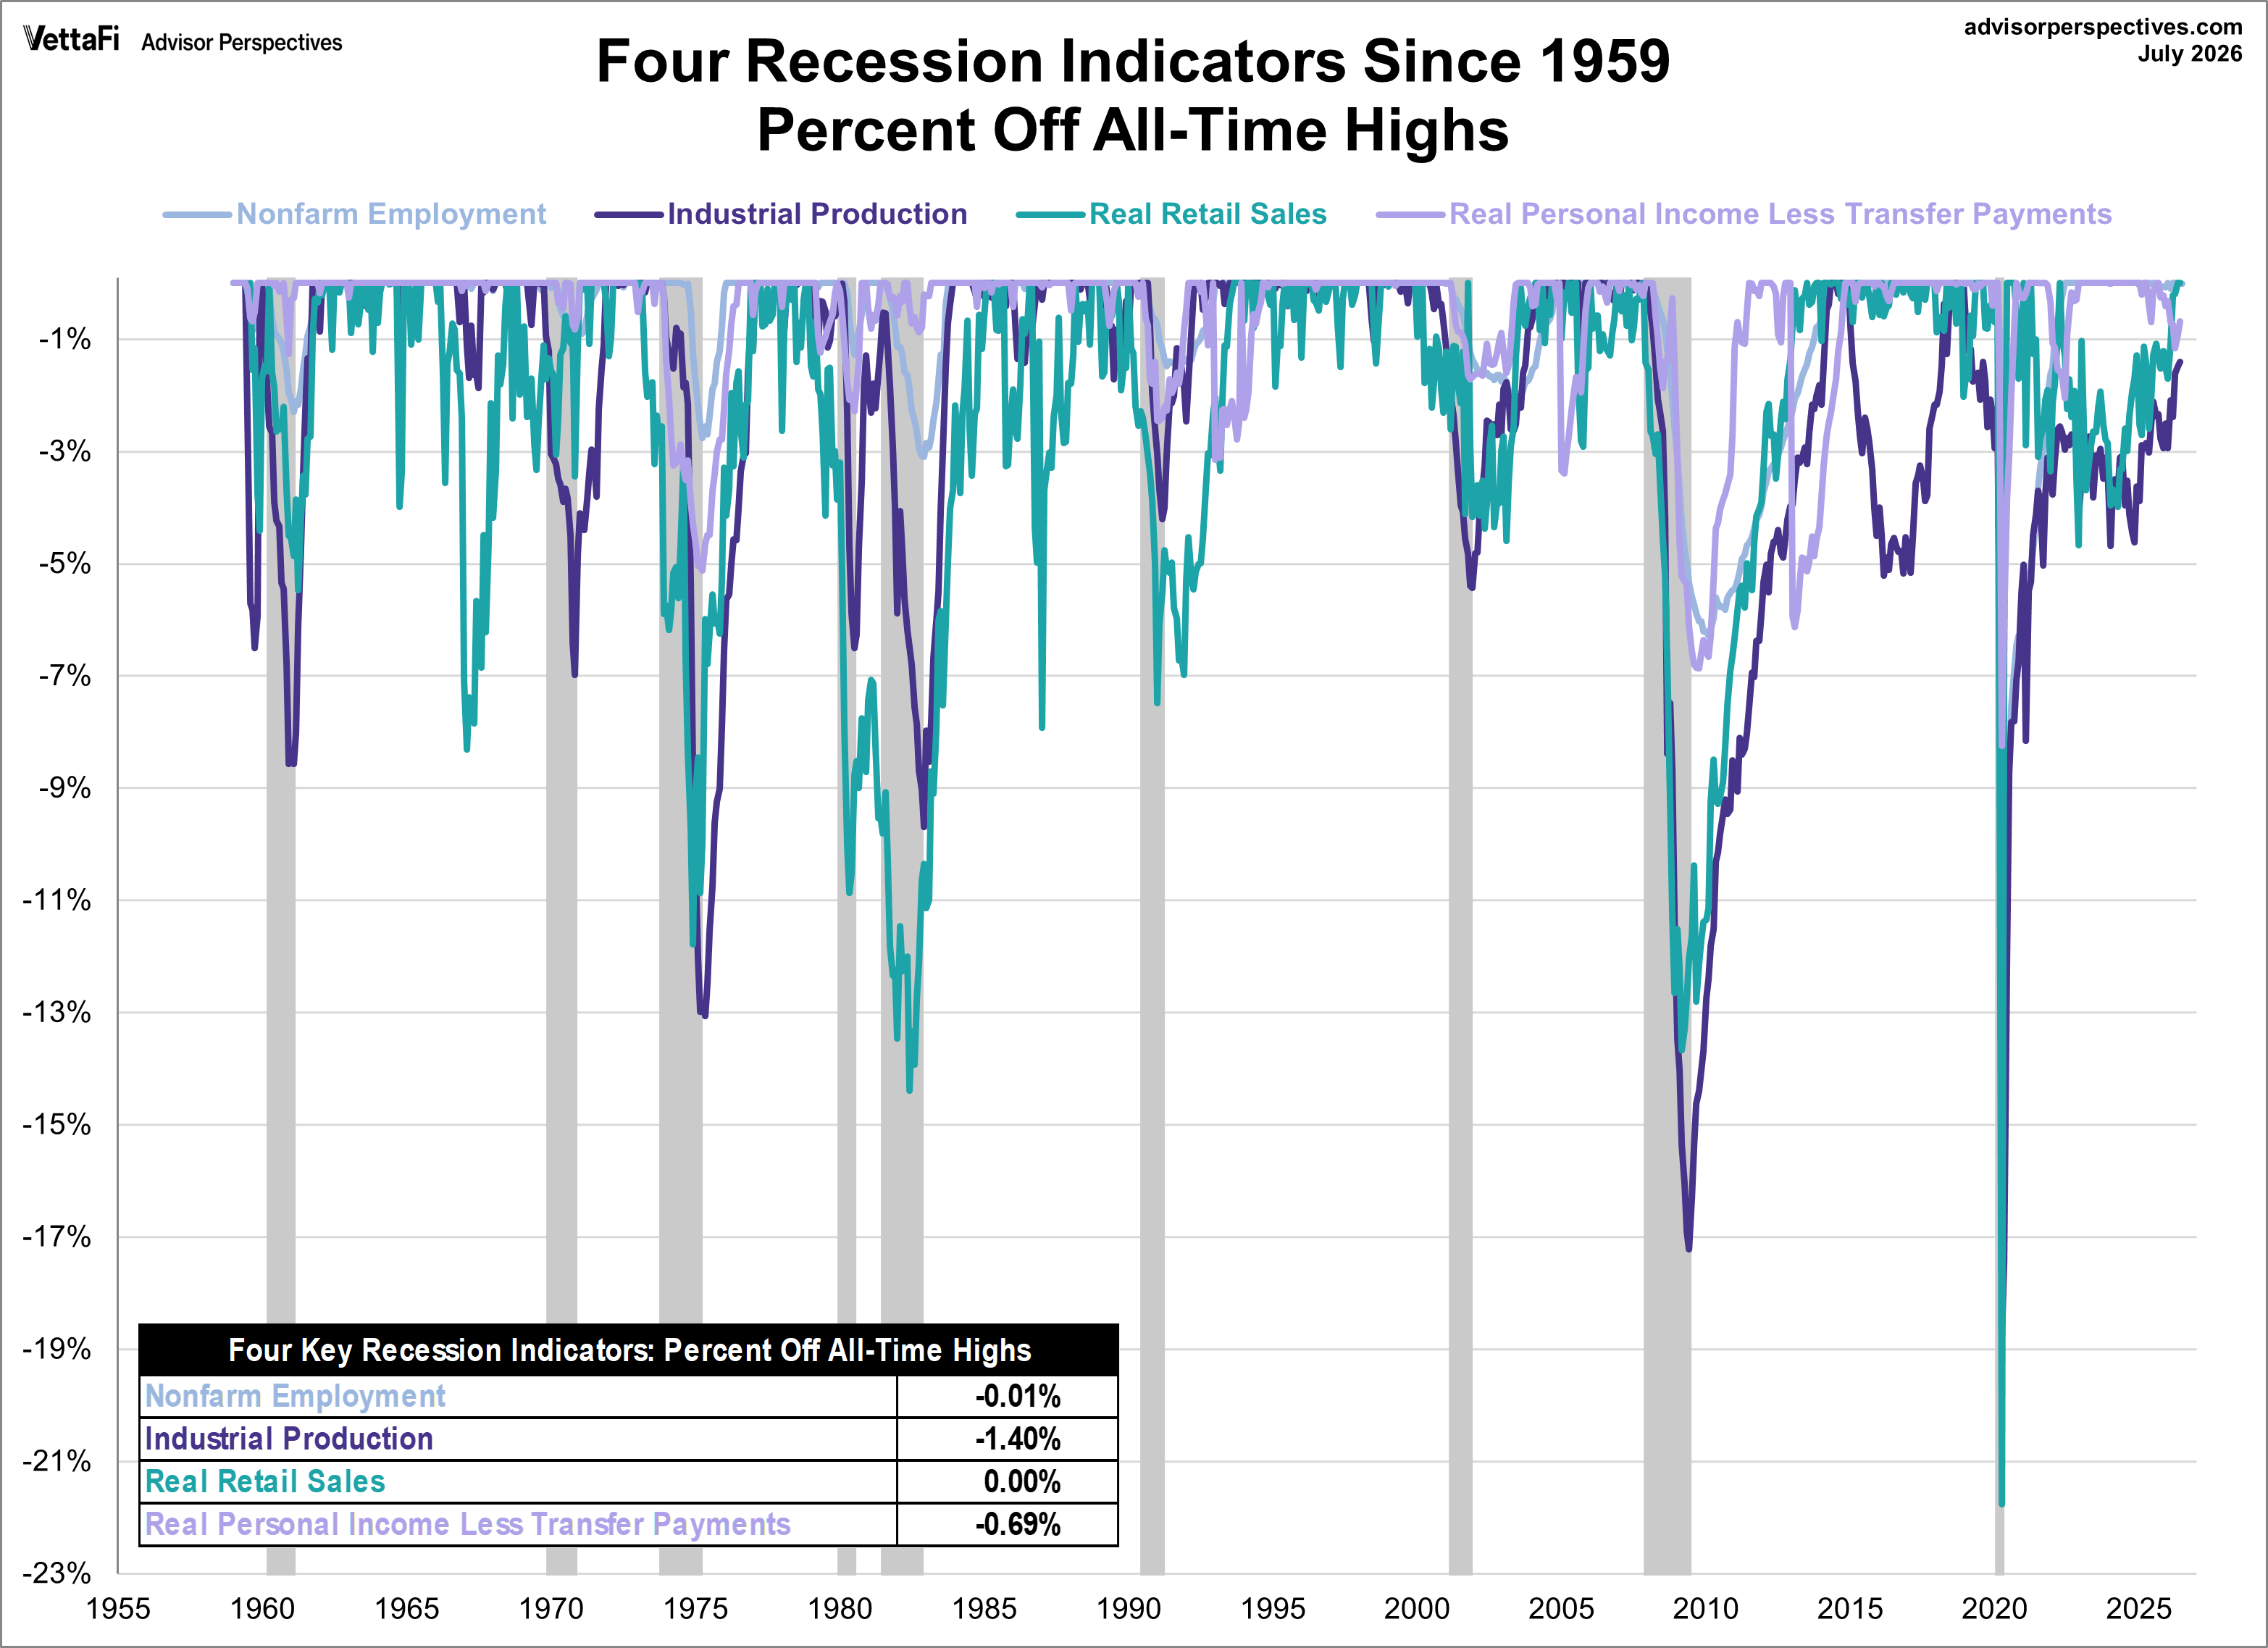
Looking at each indicator relative to its historical peak helps put the latest readings on a comparable scale. Employment and real retail sales are at record highs, while industrial production and real personal income remain below their respective peaks.
The Recovery From the COVID Recession
It is difficult to evaluate the behavior of the big four indicators immediately before the COVID recession because the downturn was caused by an extraordinary external shock rather than the typical progression of a business cycle.
The chart below shows the cumulative percentage change in each indicator from a common starting point of April 2020, the month identified by the NBER as the recession trough.
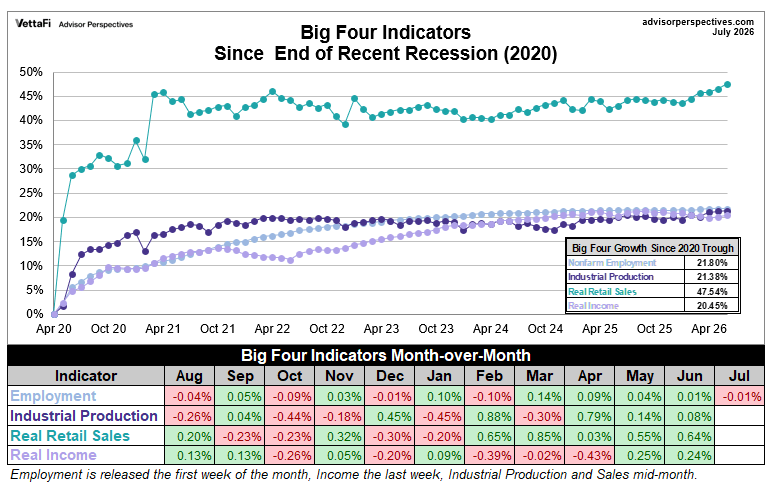
Real retail sales experienced the strongest recovery and are now 47.5% above their April 2020 level.
Industrial production initially recorded the second-fastest recovery of the four indicators before its progress moderated. It is currently 21.4% above its April 2020 level.
Employment has improved slowly but steadily since the official end of the recession and is now 21.8% above its April 2020 level.
Real personal income excluding transfer receipts has experienced the weakest recovery of the four but remains 20.5% above its April 2020 level.
The Average of the Four Indicators
The next chart combines the four indicators by calculating their average percentage below their respective all-time highs.
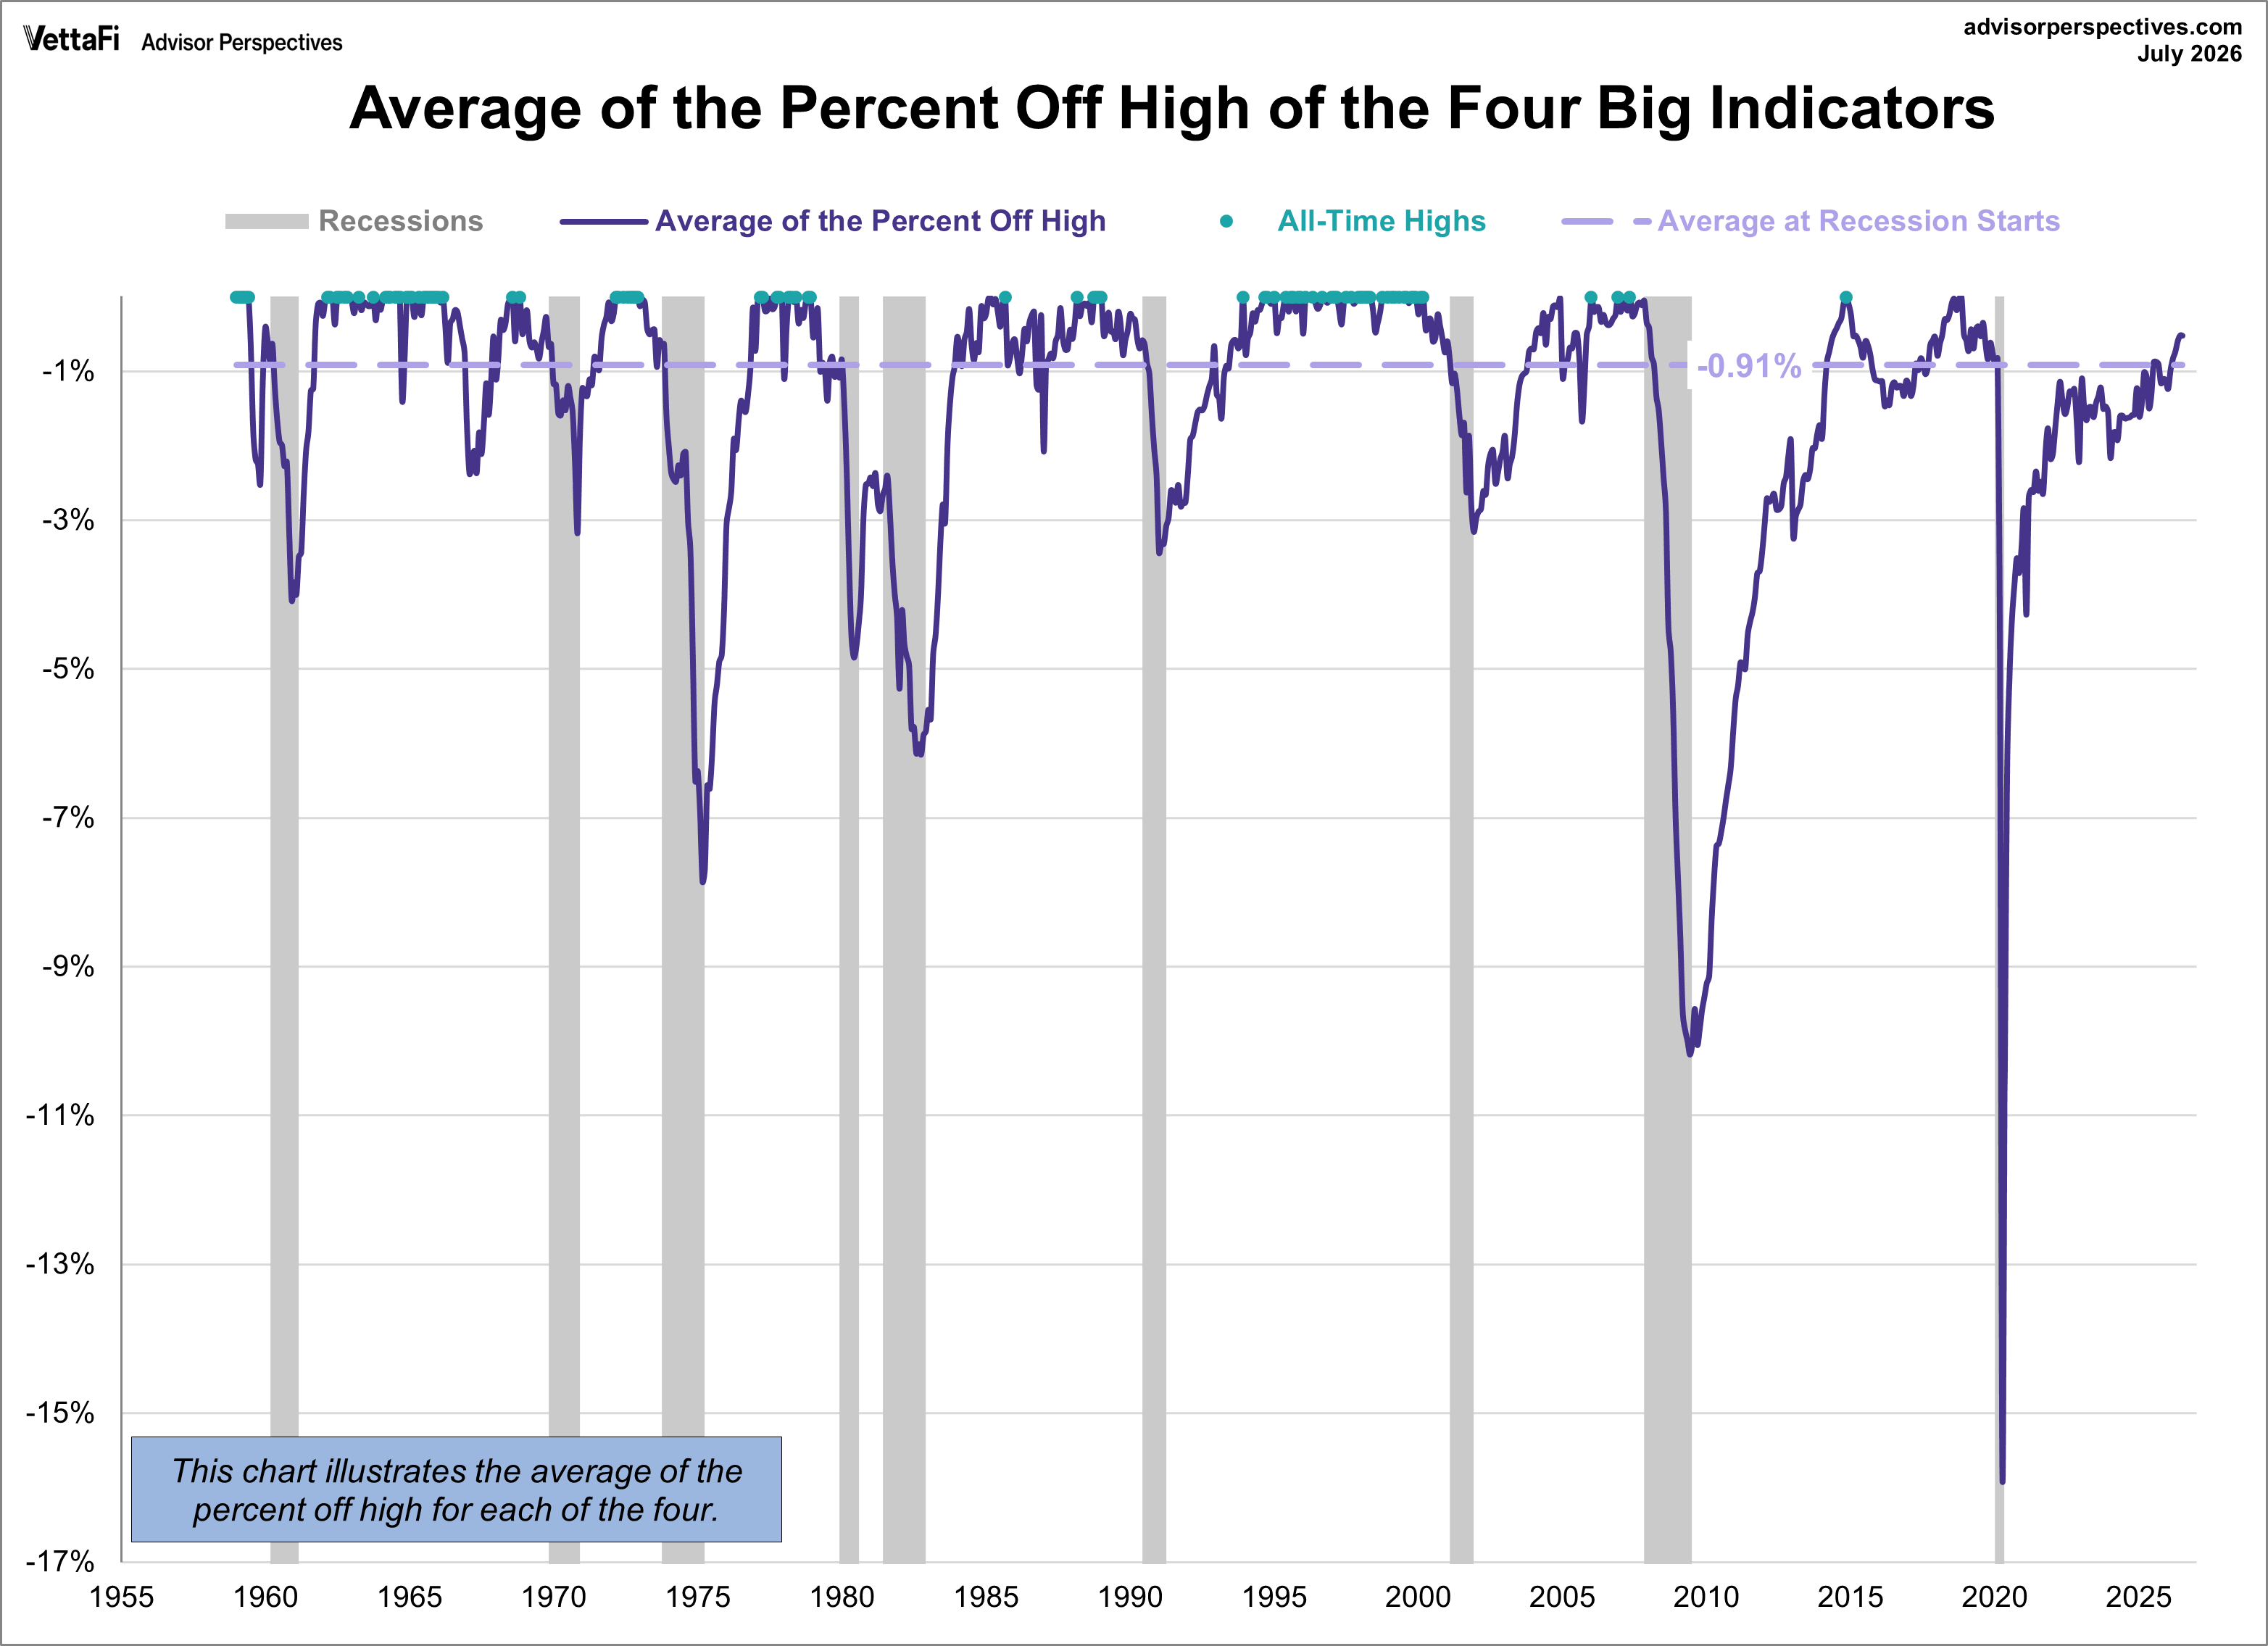
The dashed line represents the average reading at the beginning of past recessions, when the four indicators were collectively 0.91% below their highs.
The combined indicator reached an all-time high in November 2014 and came within 0.03% of that high in November 2018. The latest average is 0.53% below its high, the narrowest margin since August 2019.
The latest reading remains stronger than the historical average observed at the beginning of recessions. However, the individual indicators continue to show an uneven economic picture: employment and consumer spending are at record levels, while industrial production and real personal income remain below their previous highs.
Recession-Start Comparisons
To conclude our analysis of the big four recession indicators, the following tables compare the readings at the start of each recession since 1955.
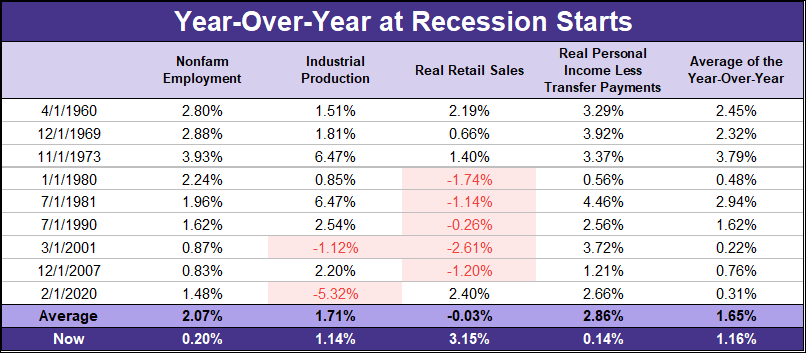
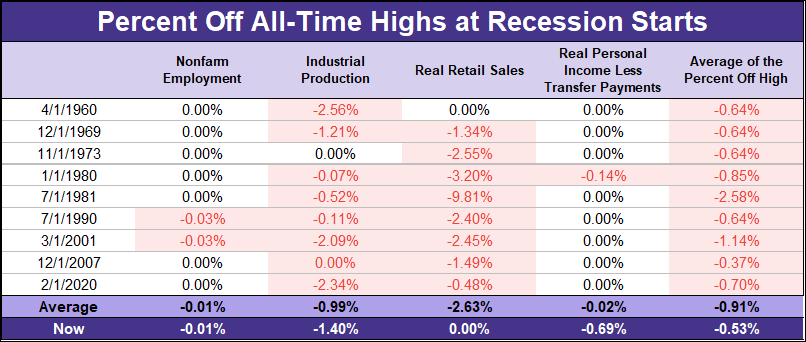
These comparisons illustrate why no single data series is sufficient to identify a recession. The timing and severity of declines vary across indicators, making the broader direction of the four measures more informative than any one reading in isolation.